Serial Port Monitor (Sniffer)
Serial Communication Monitoring, Debugging and AnalysisOS: Windows and Linux only.
Debugging and analysis of serial communications can be incredibly challenging. Without the right tools, users often face issues like incomplete data visibility, difficulty identifying errors, and an inability to effectively analyze complex protocols. This can lead to wasted time, frustration, and missed opportunities to resolve critical issues efficiently.
Serial Monitor provides a comprehensive solution for all your serial communication needs. By offering features like detailed logging, flexible data views, and advanced analysis tools, Serial Monitor ensures you have complete control and understanding of your serial data. It simplifies troubleshooting, accelerates debugging, and empowers users to tackle even the most complex serial challenges.
What Makes Serial Monitor so Great?
"True" Serial Monitoring on Linux
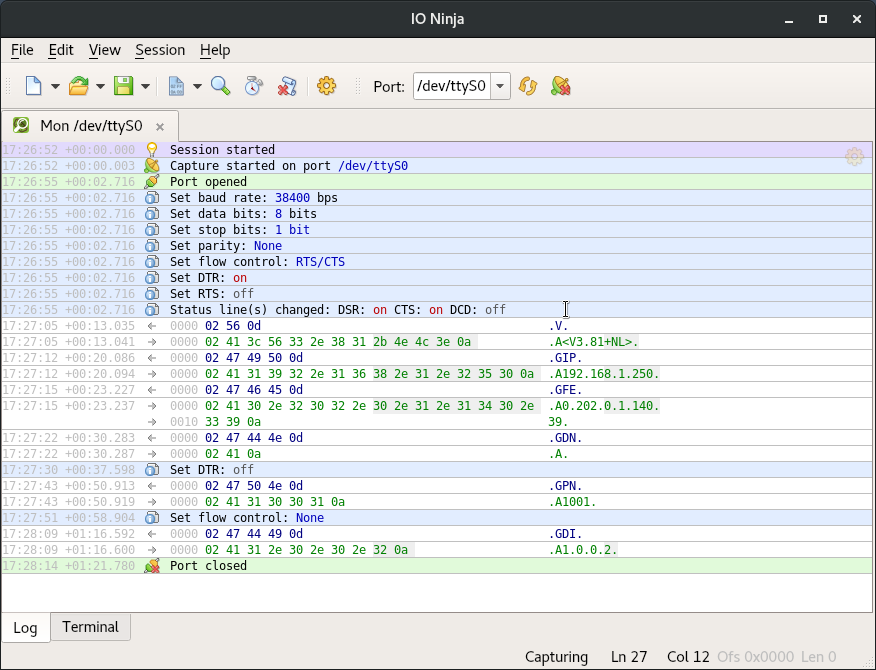
Unlike many other so-called serial sniffers for Linux (that usually require you to redirect the IO streams of an application in order to monitor), our serial monitor intercepts calls between an application and the serial TTY kernel module, allowing direct monitoring of serial communications performed by applications on your Linux box.
Powerful & Beautiful Logging Engine
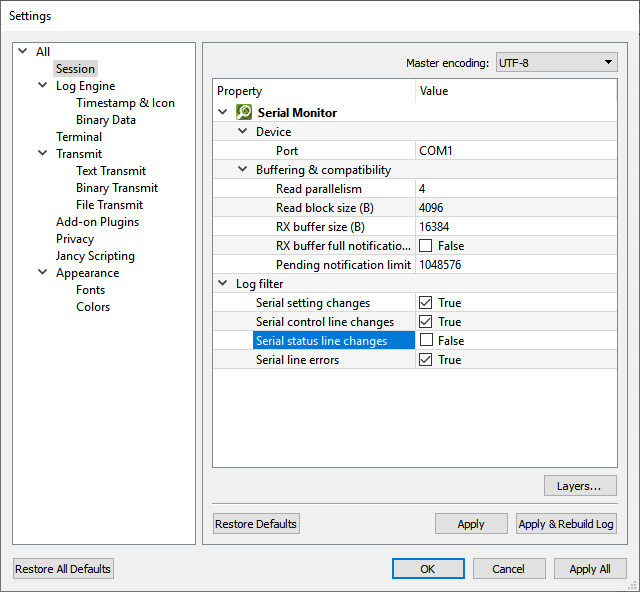
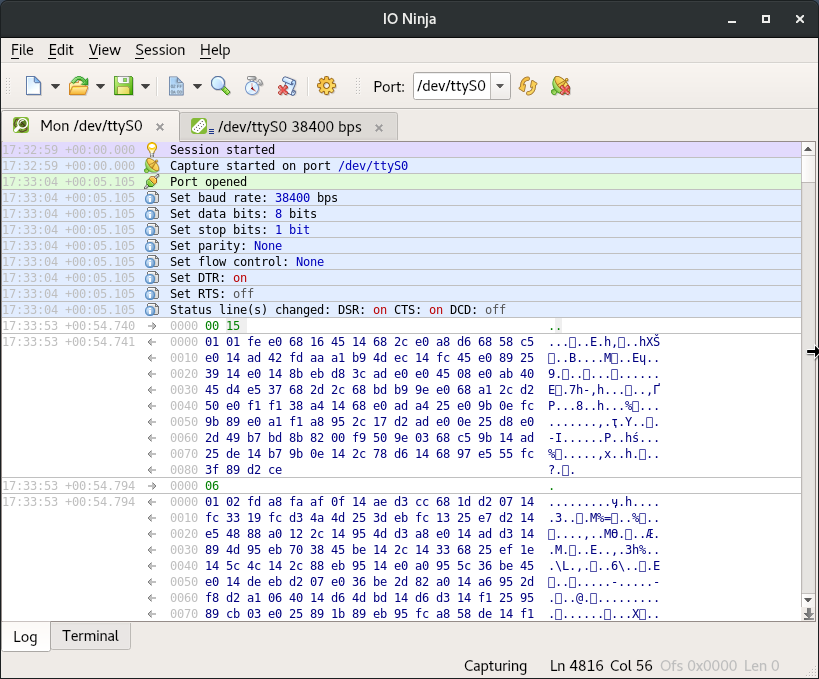
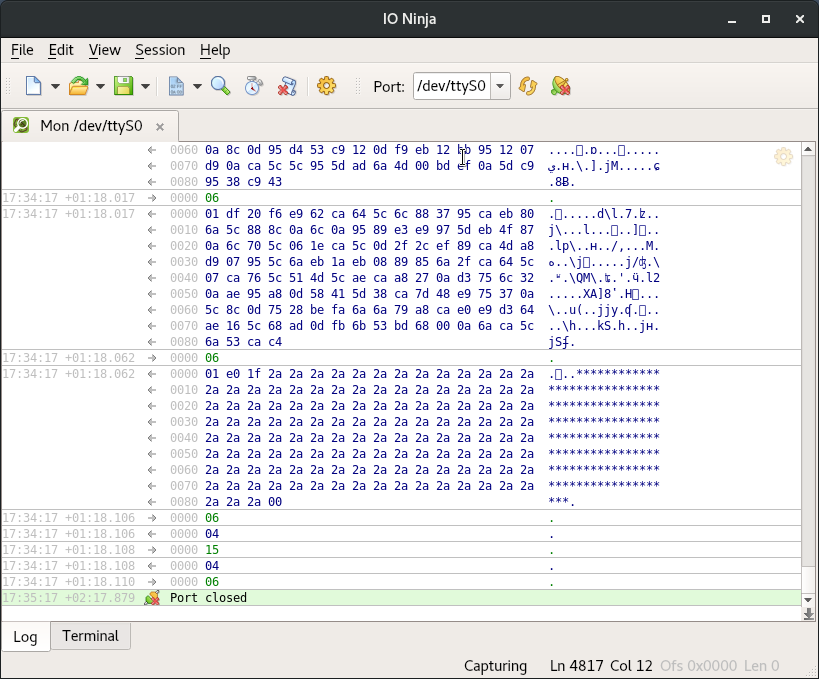
The Ninja Scroll logging engine is the heart of IO Ninja! It offers many unique and useful features you won't find in other serial monitors, such as interleaving binary data with informational messages for a clear timeline of events, switching between hex-view and plain-text view of binary data, a regex markup engine for highlighting data based on regular expressions, and many others!
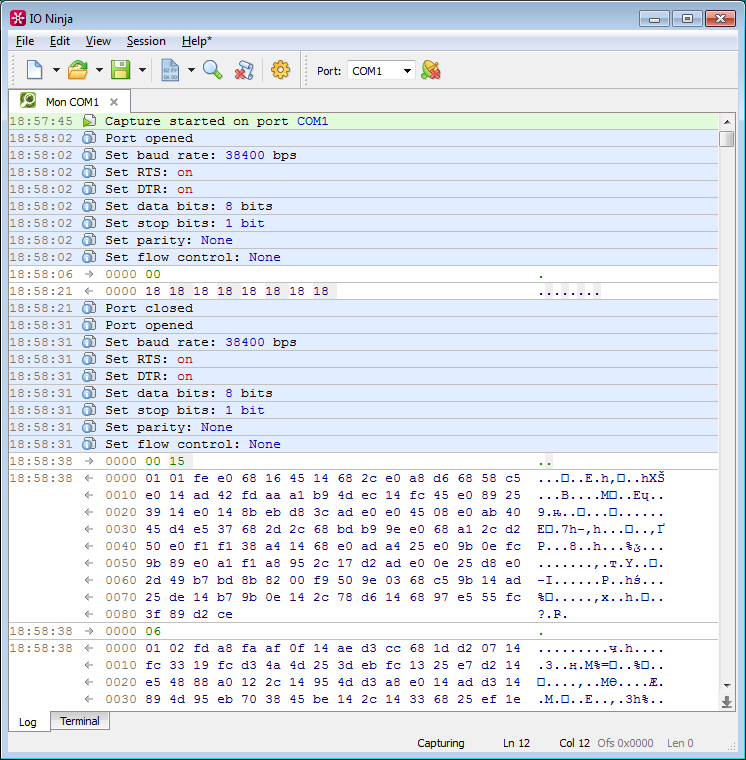
View As X-Term
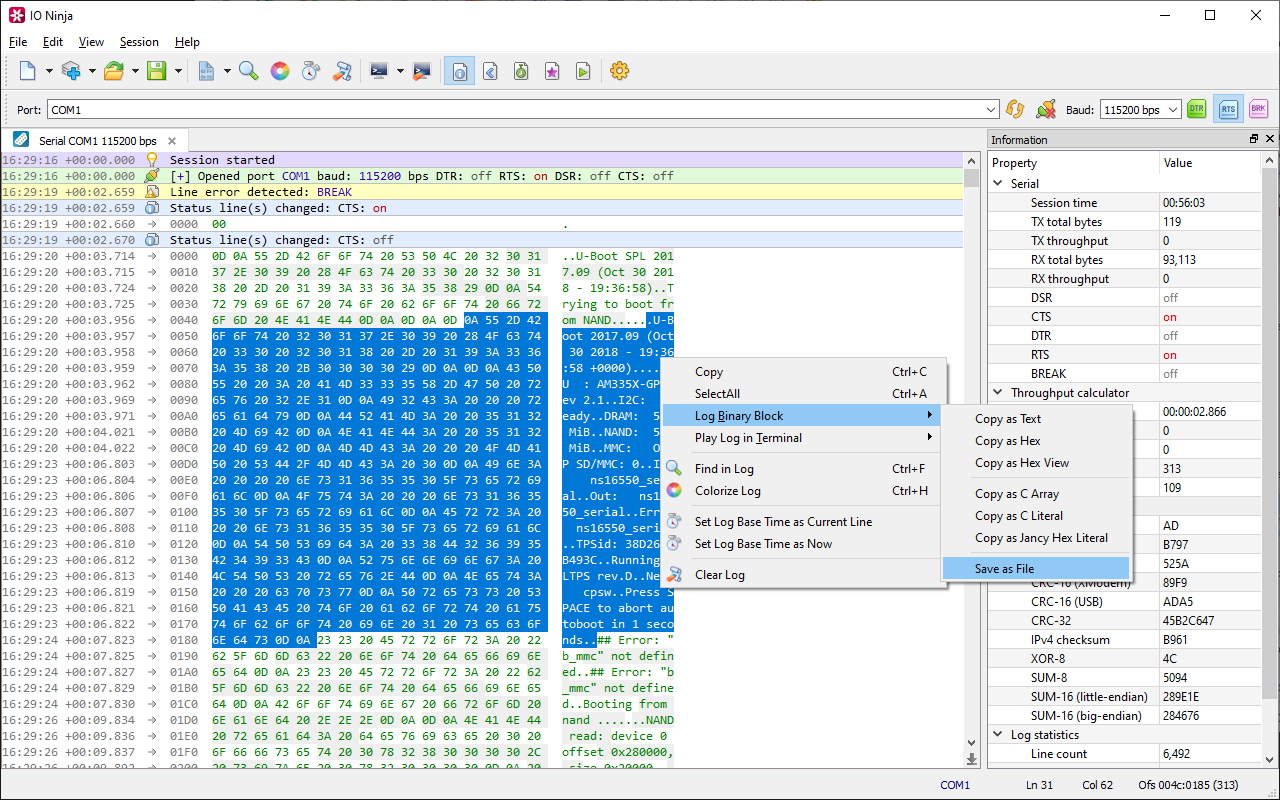
Serial Monitor is a non-intrusive sniffer and hence, doesn't allow transmission. However, you may want to know how the captured data looks in a terminal console.
IO Ninja features a fully compatible X-Term terminal view that allows you to render any portion of the captured data.
Just select a range of bytes and Play Selection In Terminal.

Modbus RTU
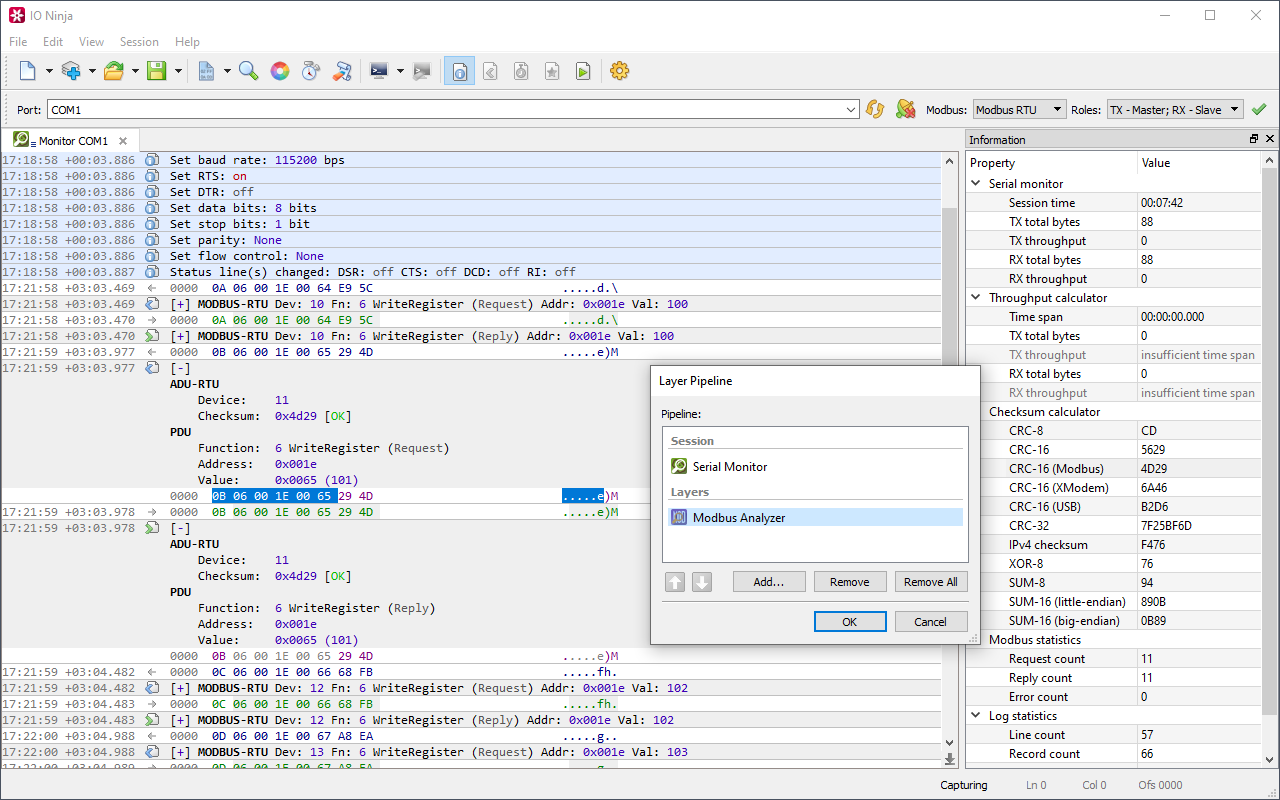
Modbus RTU (especially over RS-485) is widely used in industrial automation, so it's no wonder that IO Ninja features the Modbus Analyzer plugin for decoding Modbus frames. Attach it as a layer to your Serial Monitor session and enjoy the human-readable representation of Modbus commands and replies. The original data is complemented, not replaced — so nothing is lost.
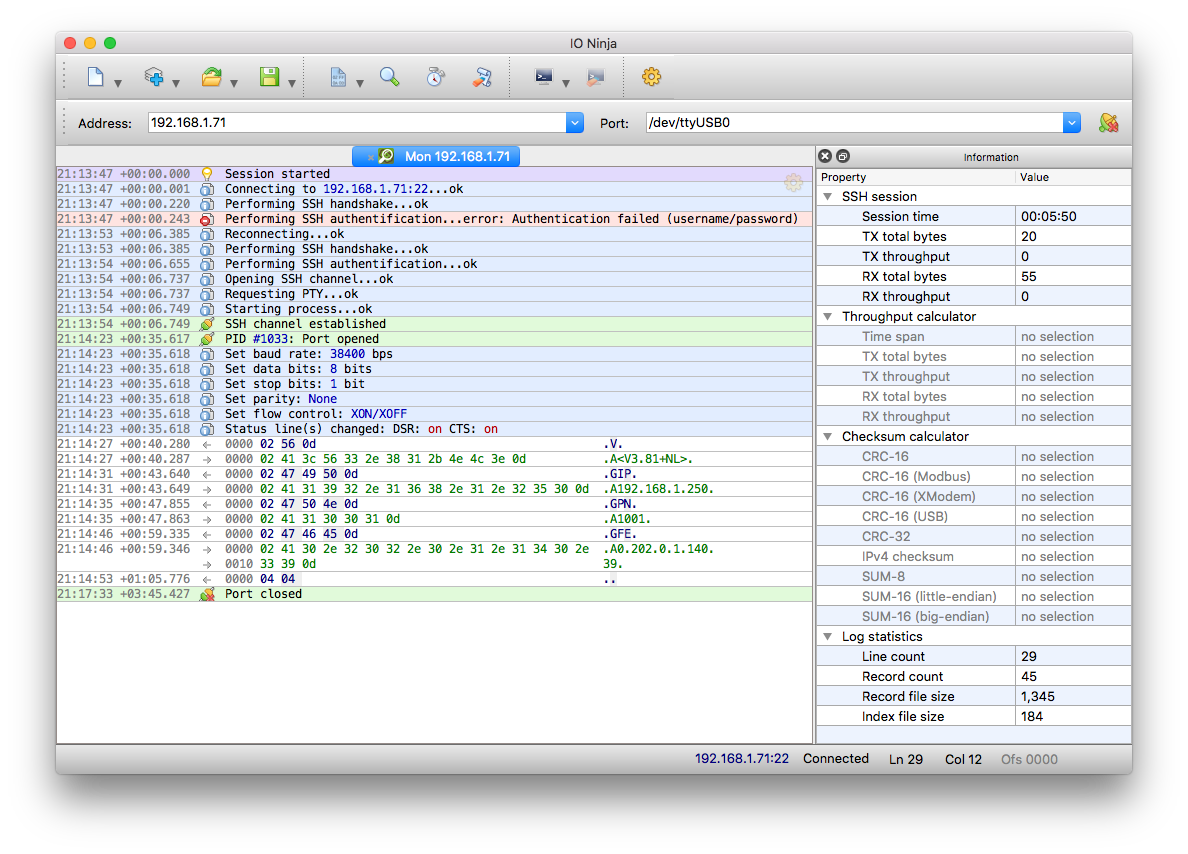
Monitor Remote Serial Ports
You can easily connect to remote serial ports over SSH, whether the target machine is running Linux, Windows, or macOS.
Once the SSH server and the Device Monitor (tdevmon) service on the target machine are running, you can monitor serial ports on this remote machine over SSH just like you do with local ports!
Built on the Device Monitor Service
Serial Monitor uses the Device Monitor (aka tdevmon) service, consisting of a kernel-mode module intercepting requests from applications to the specified devices and a user-mode configuration utility.
Installation and proper configuration of the Device Monitor service are sometimes stumbling points for users. Please follow these knowledge base articles for more information:
Getting Started
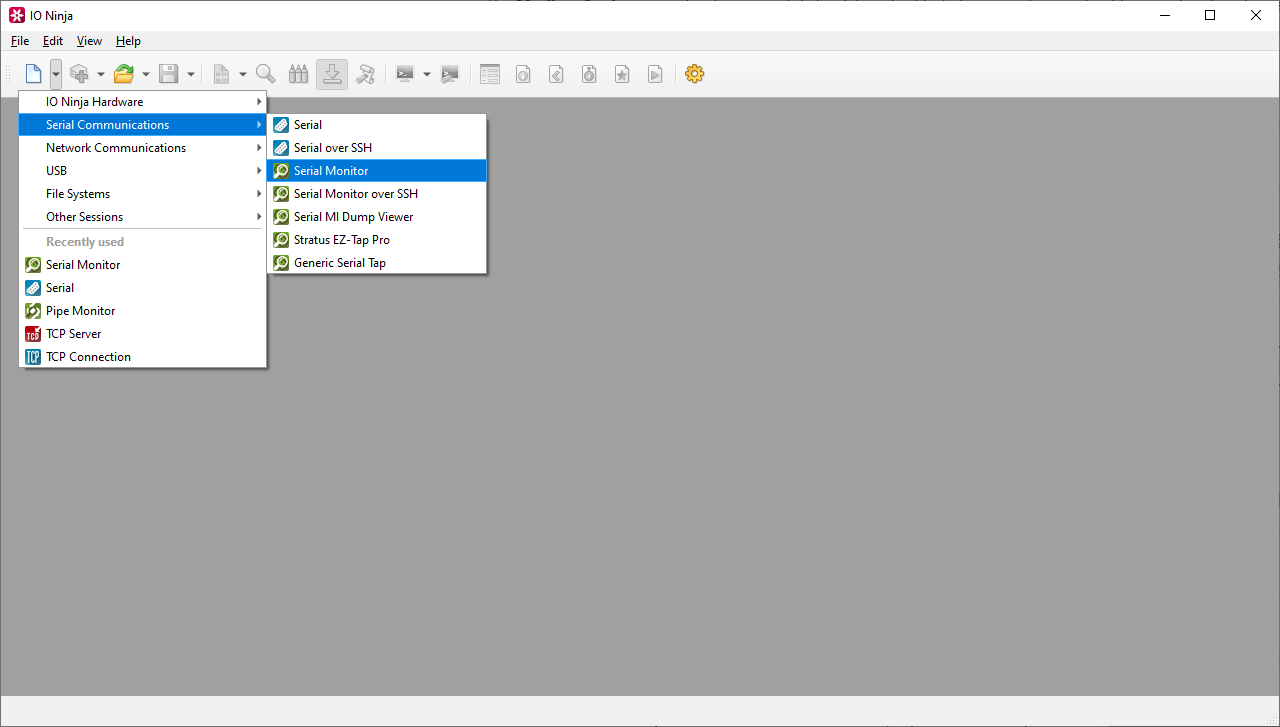
Step 1. Start a Monitoring Session
Begin by launching a Serial Monitor session.
Ensure you have Device Monitor installed before starting this step, please refer to our knowledge base.
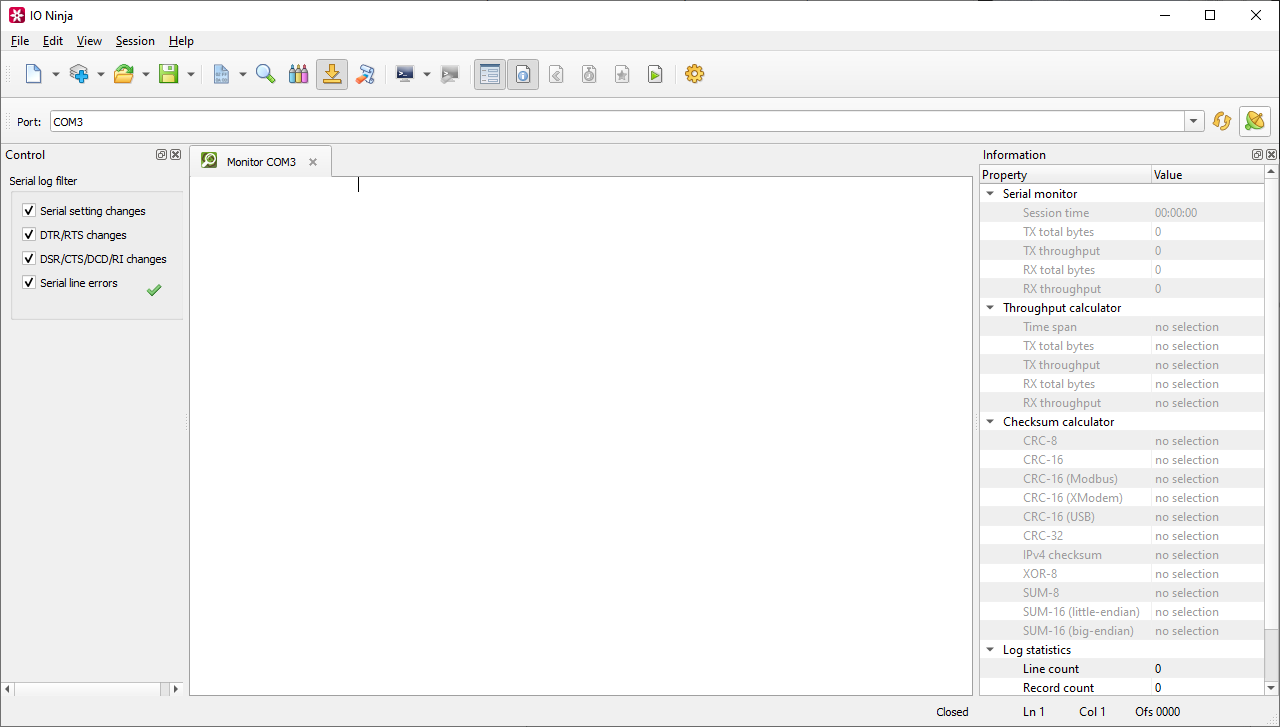
Step 2. Start Capturing
Click the "Capture" button on the far right of the port selection bar.
If you encounter an "Access is denied" error, please refer to our knowledge base.
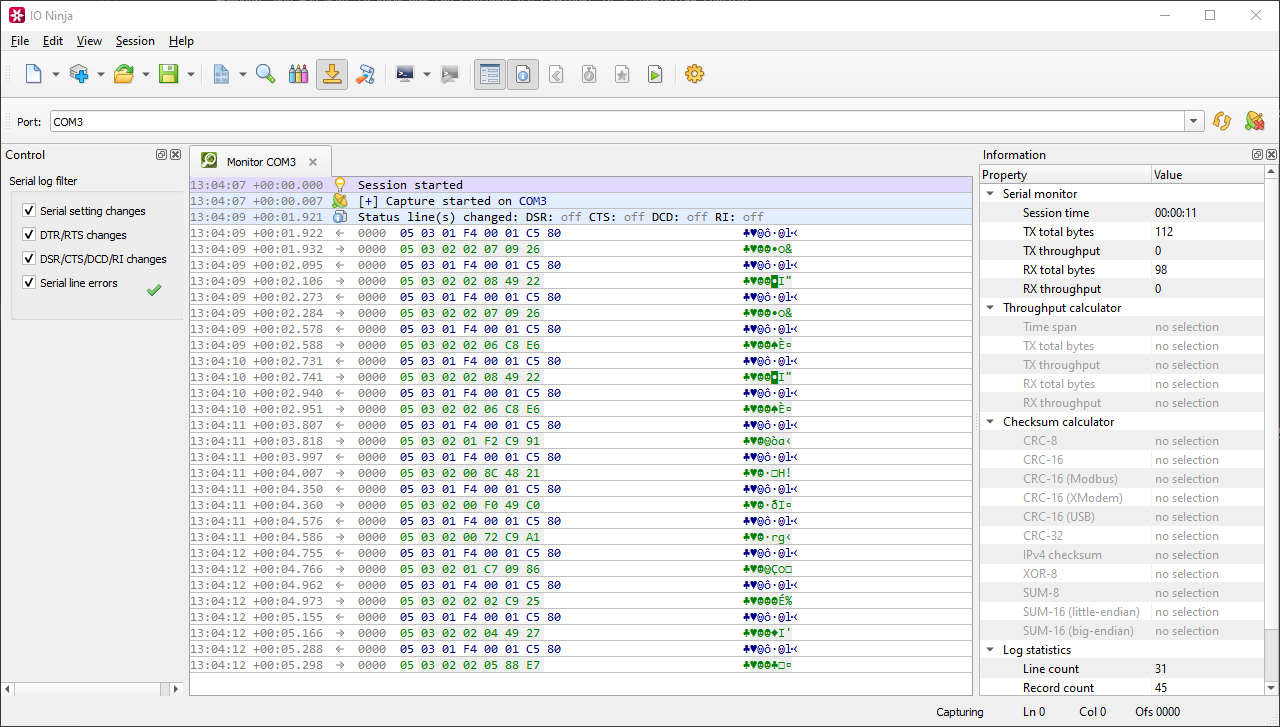
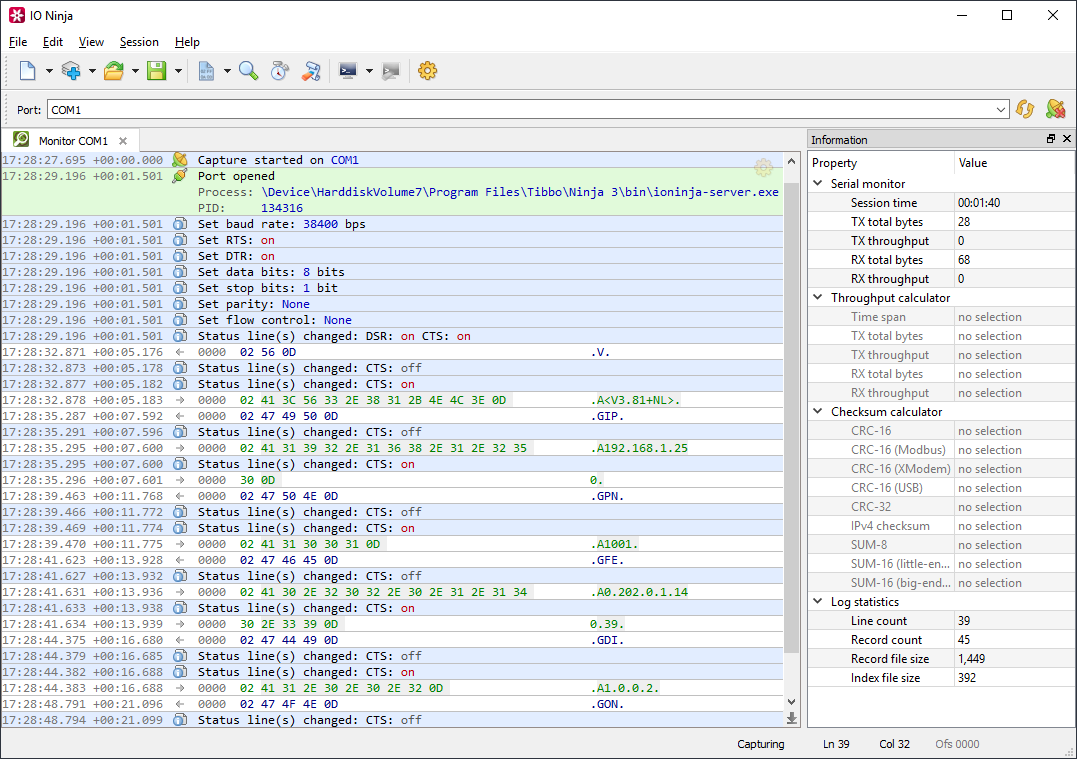
Step 3. Analyze Serial Traffic
View the serial communication in the Serial Monitor window.
Documentation
See Also
| Plugin | Relevance |
|---|---|
| A hardware sniffer for monitoring RS232, RS485, and TTL-level UART comms. | |
| Makes modbus communication easy. | |
| Construct, send, receive, and analyze serial packets. | |
| Monitor serial port activity initiated by applications on a remote machine. |
Gallery