TCP Flow Monitor
Traditional packet-based sniffers often fall short when it comes to intuitively following the flow of communication between network nodes. While some tools offer post-processing features like “Re-create Conversation,” they still rely on manual packet capture and later reconstruction—steps that can be tedious and inefficient, especially when handling binary data.
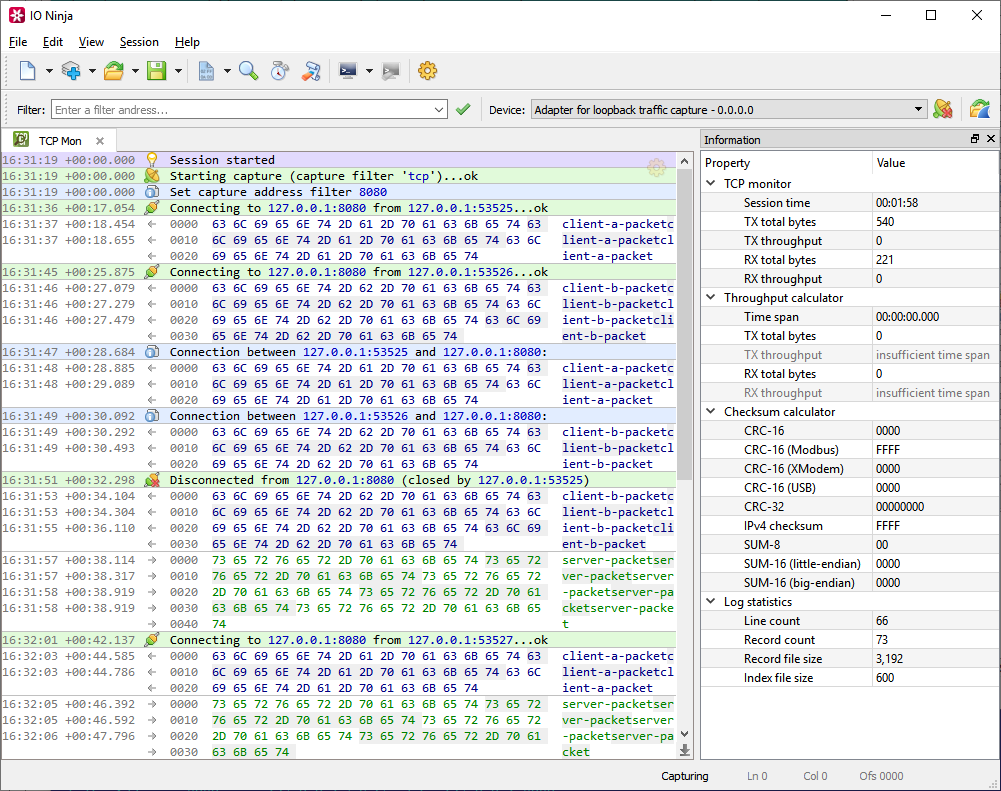
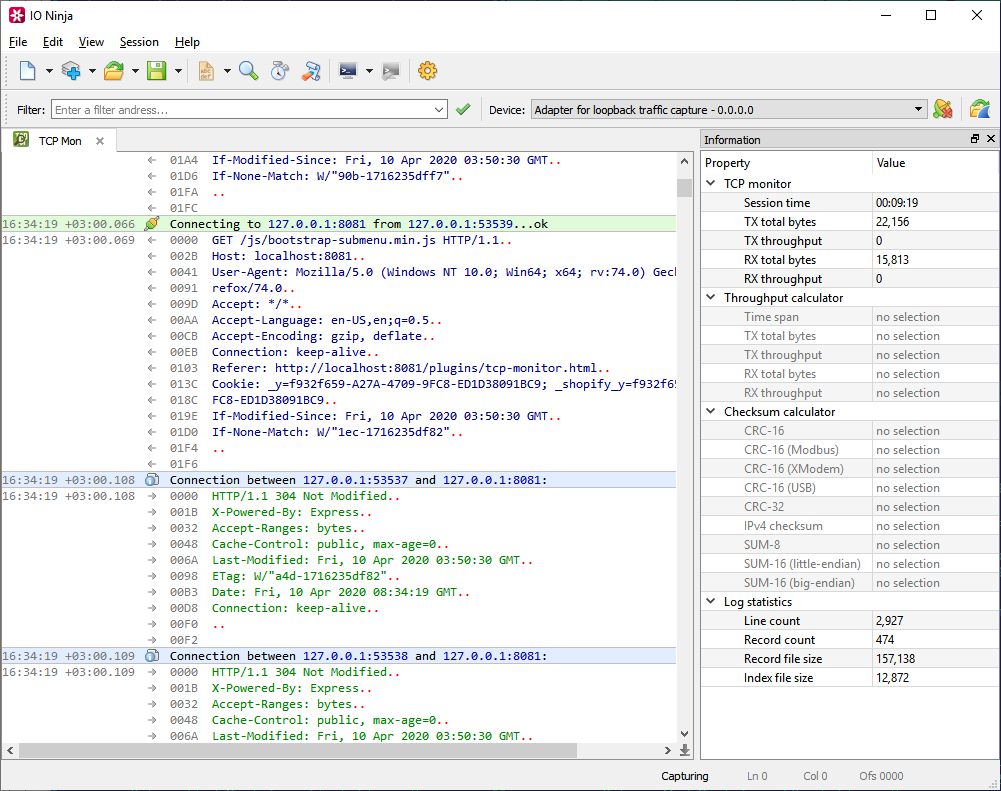
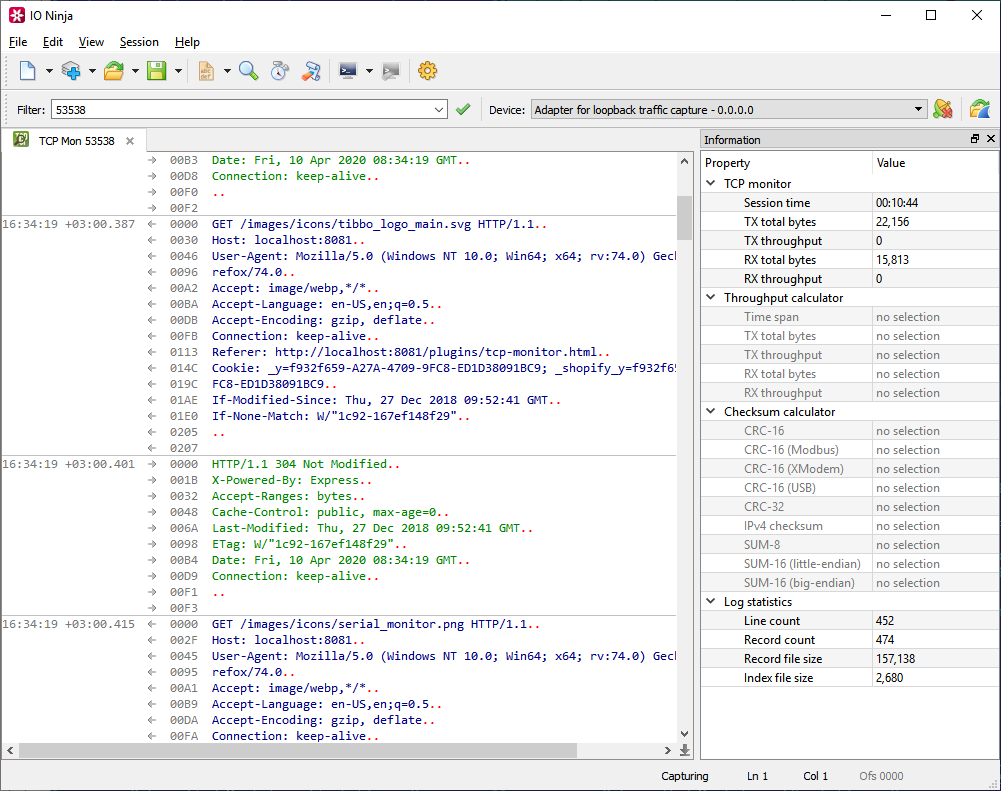
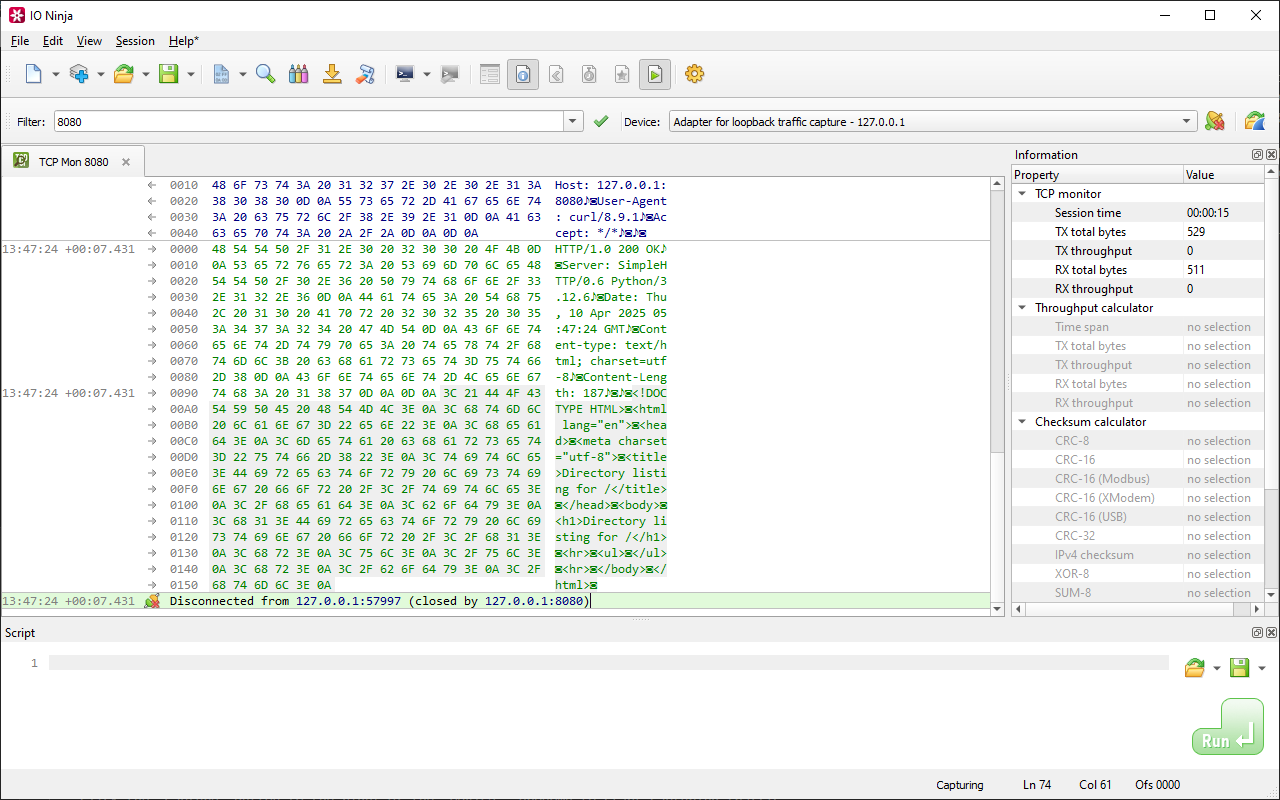
The TCP Flow Monitor plugin provides an elegant way to see just the data and nothing else. Specify an interface to capture packets on, specify a filter in the form of address (or just port) — and forget about packets! You will receive a clean log of data exchanges reconstructed in real time from the captured packets behind the scene. You don't need to capture packets first and re-create TCP conversations later! The end result will look just like the one you see in TCP Proxy or TCP Server plugins.
Why TCP Flow Monitor?
Real-Time TCP Conversation Monitoring
The TCP Flow Monitor plugin eliminates the traditional two-step process of capturing and then manually reconstructing network conversations. By simply selecting a network interface and setting a minimal filter—such as a specific IP address or port—you can instantly begin viewing TCP data as it is exchanged. The plugin reassembles conversations on the fly, providing a clean, real-time log that strips away low-level packet clutter. This live reconstruction mimics the simplicity and clarity of tools like TCP Proxy or TCP Server, offering a direct look at the payload data without requiring you to dig through raw packet dumps.
Multi-Session Support and Filtering
The plugin is built to handle the complexities of modern network environments where multiple TCP conversations may occur simultaneously. It supports parallel tracking of multiple flows, ensuring you can observe a broad range of interactions without missing critical data. When the log becomes overwhelming, built-in filtering options allow you to narrow your focus to a single conversation, effectively hiding irrelevant traffic. This makes log navigation intuitive and efficient, allowing for focused analysis even in noisy or high-traffic scenarios.
Binary-Friendly Logging with Ninja Scroll Engine
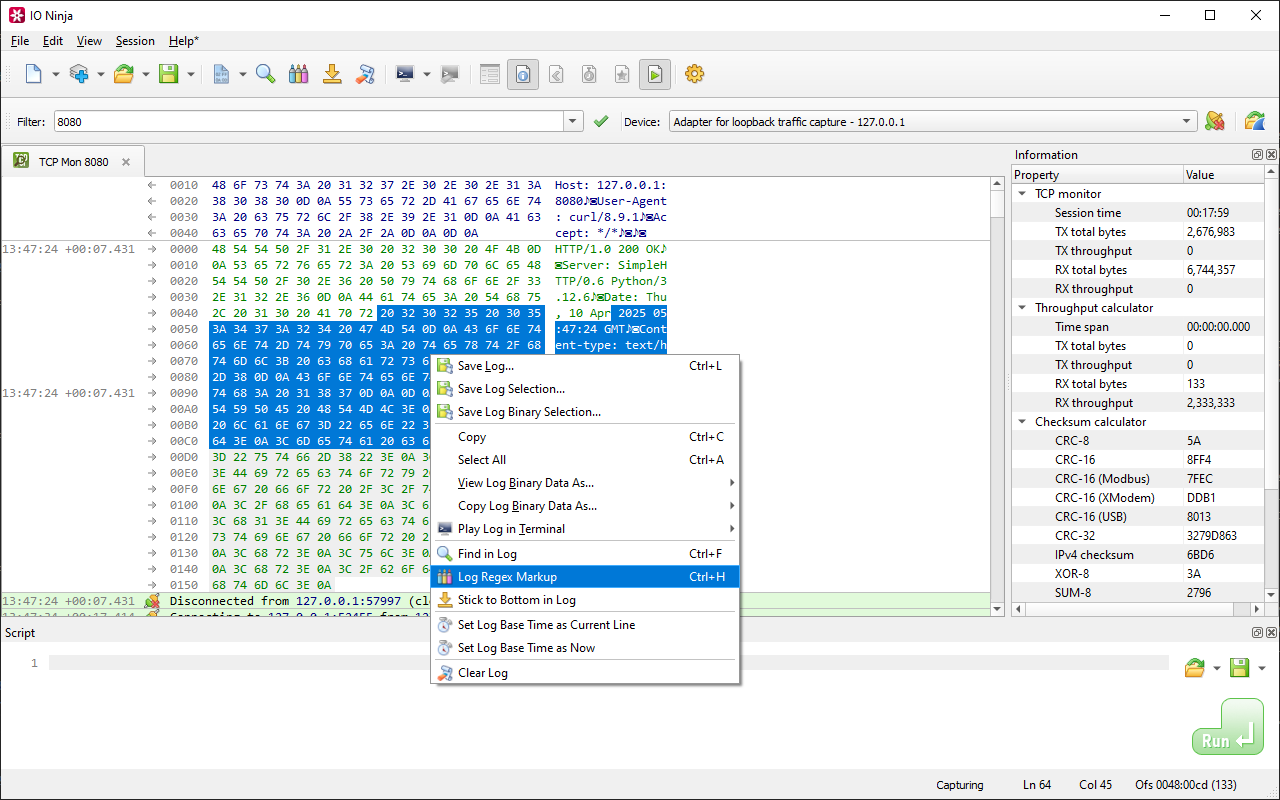
At the heart of the plugin lies the Ninja Scroll Logging Engine, a powerful logging framework designed specifically with binary data in mind. This engine enables seamless merging of packets into coherent streams, making it easier to interpret messages that span multiple transmissions. Users can effortlessly toggle between hexadecimal and plain-text views to suit the nature of the data being inspected. Furthermore, the engine offers advanced tooling such as byte-level offset and length visualization, and the ability to search for binary patterns—even if they cross packet boundaries. This is a significant advantage for developers working with custom or binary-heavy protocols.
Backed by libpcap
TCP Flow Monitor runs on libpcap, a widely trusted packet capture library. It provides a reliable backbone for real-time monitoring, and IO Ninja builds on top with scripting, visualization, and transmission.
Getting Started
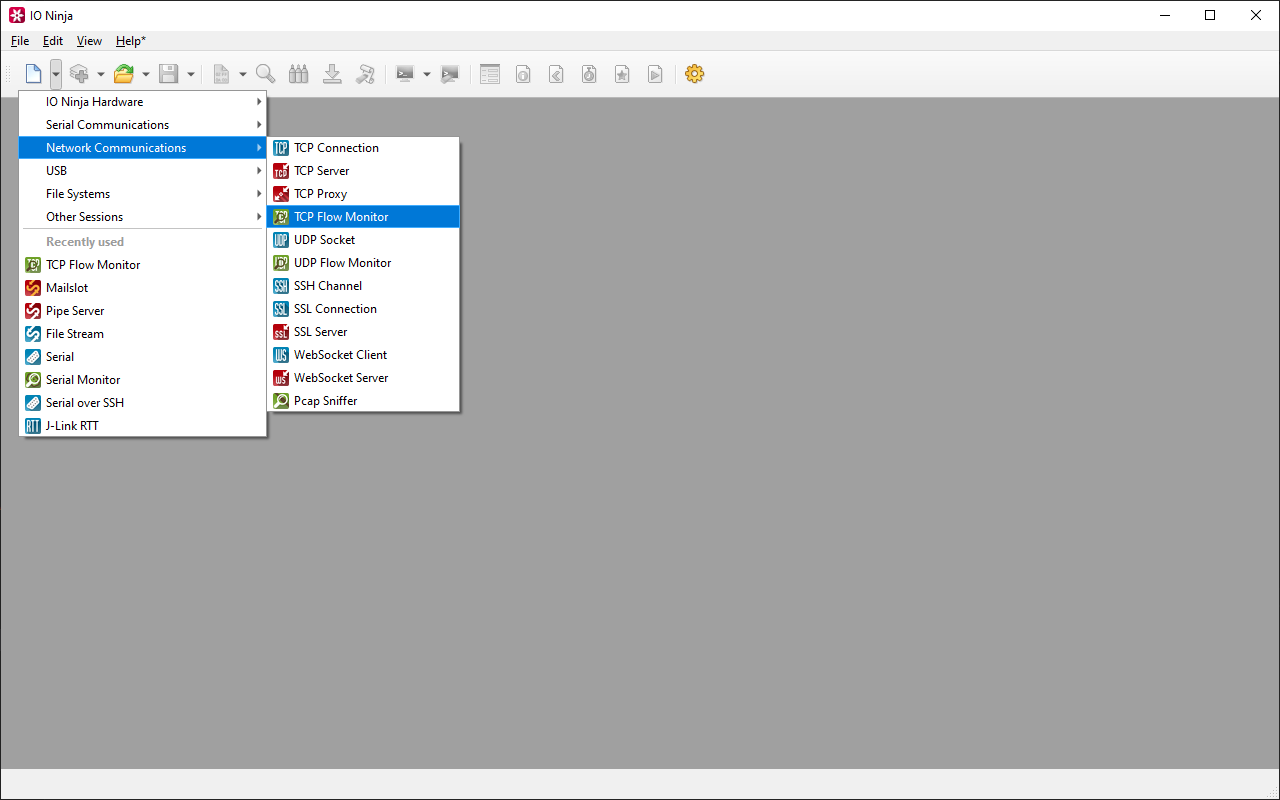
Step 1. Start a Session
Begin by launching a TCP Flow Monitor session.
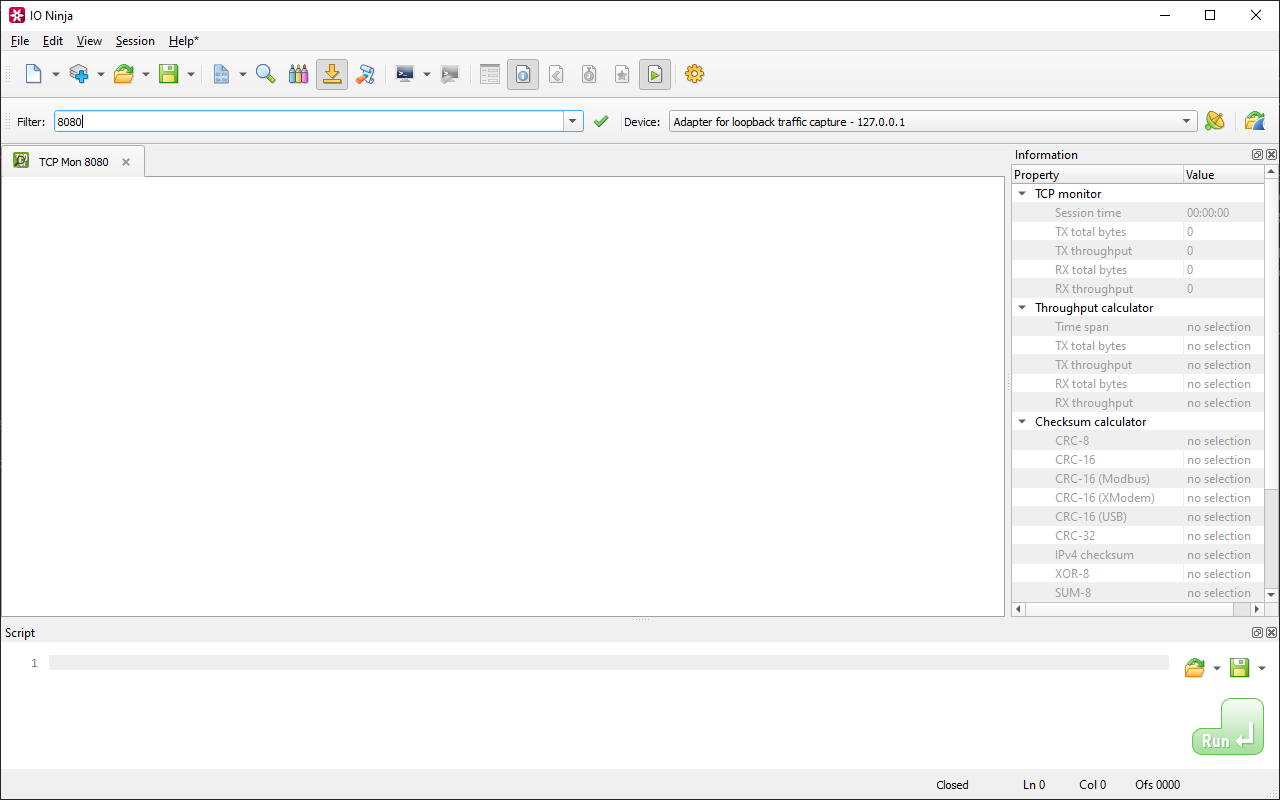
Step 2. Set Capture Filter
In the "Filter:" field, type a capture filter, e.g. "8080" (to capture traffic on port 8080).
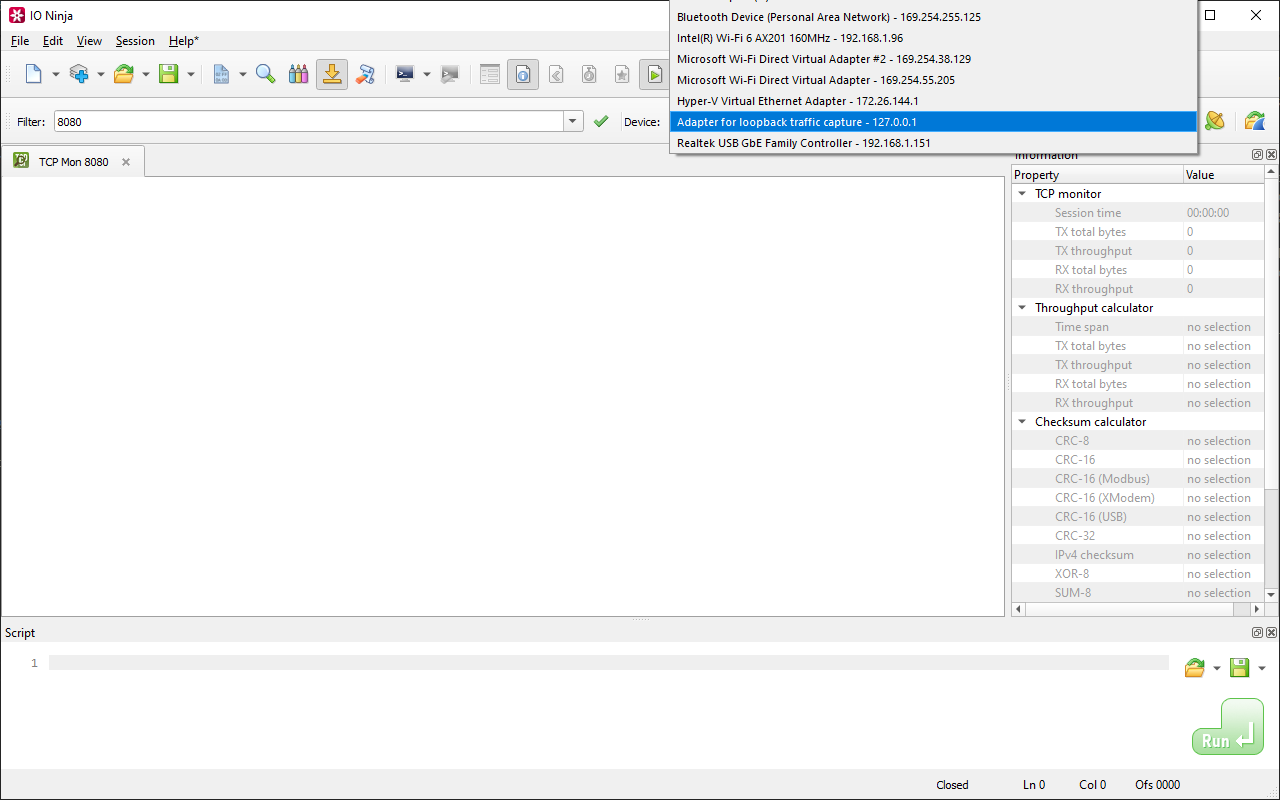
Step 3. Set Network Interface
Select a network interface from "Device:", e.g. "Adapter for loopback traffic capture" for localhost.
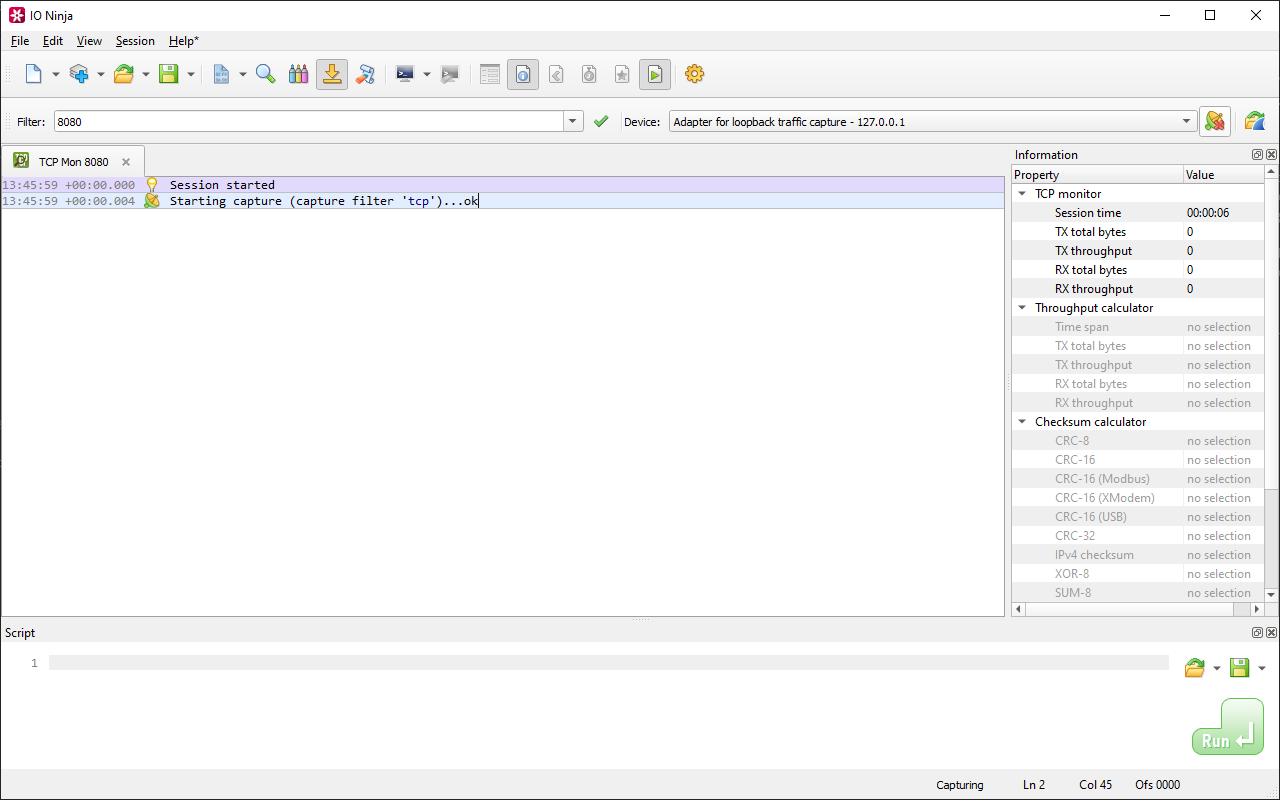
Step 4. Start Capturing
Click the "Capture" button to the right of the "Device:" dropdown to start capturing traffic.
Step 4. Monitor Traffic
Monitor TCP traffic captured according to your filter.
Documentation
See Also
| Plugin | Relevance |
|---|---|
| An essential tool for inspecting data exchanged between two TCP nodes. | |
| Connect, send and analyze TCP packets. | |
| Accept incoming TCP connections. | |
| The layer version of TCP Flow Monitor. |
Gallery