Ethernet Tap
Ethernet Tap does NOT require any paid IO Ninja capabilities or subscriptions! The Ethernet Tap plugin is always ENABLED and can be used under any IO Ninja account (including GUEST).
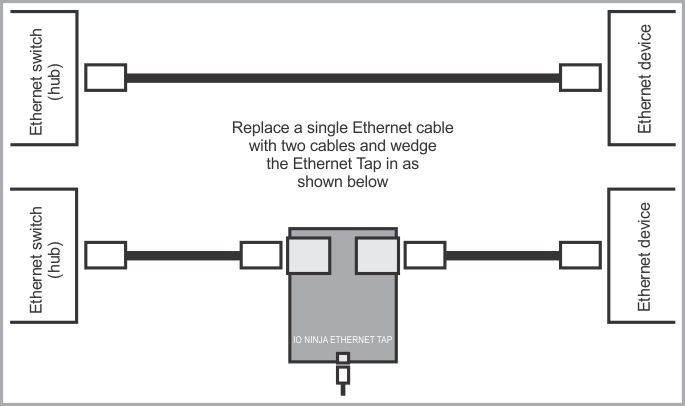
Ethernet Tap is a hardware sniffer for monitoring Ethernet traffic flowing through a single Ethernet connection. The Tap passes the Ethernet traffic through with a delay equal to about 5.2uS.
Connecting Ethernet Tap
To monitor Ethernet traffic, an Ethernet cable that was initially connecting a switch (hub) to an Ethernet device is replaced by two Ethernet cables and the Ethernet Tap is inserted between them, in what is known as a "wedge" fashion.
Key Features
- Reliably captures
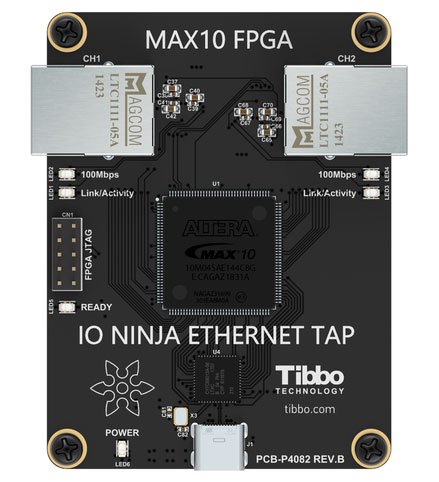
10Base-Tand100Base-TEthernet traffic. - Based on Intel MAX10 FPGA.
- Six LEDs onboard:
- Green Ready LED;
- Green 100Mbps LED (left
RJ45jack); - Green 100Mbps LED (right
RJ45jack); - Yellow Link/Activity LED (left
RJ45jack); - Yellow Link/Activity LED (right
RJ45jack); - Blue Power LED.
- High-speed (480Mbps)
USB2.0interface on aUSB-Cconnector. - Supplied with a
USB-Ccable. - USB-powered, no additional external power necessary.
- Compact, outside dimensions only
82 x 74 x 30 mm. - The product is field-upgradeable via the USB interface.
Hardware Specifications
| Parameter | Value |
|---|---|
| USB: | USB 2.0, high-speed (480MHz), USB-C connector |
| Throughput: | Up to 100BaseT Ethernet's real-life throughput |
| Operating temperature: | 0 to +60 degrees C |
| Operating relative humidity: | 10% to 90% |
| Mechanical dimensions: | 82 x 74 x 30 mm |
Usage
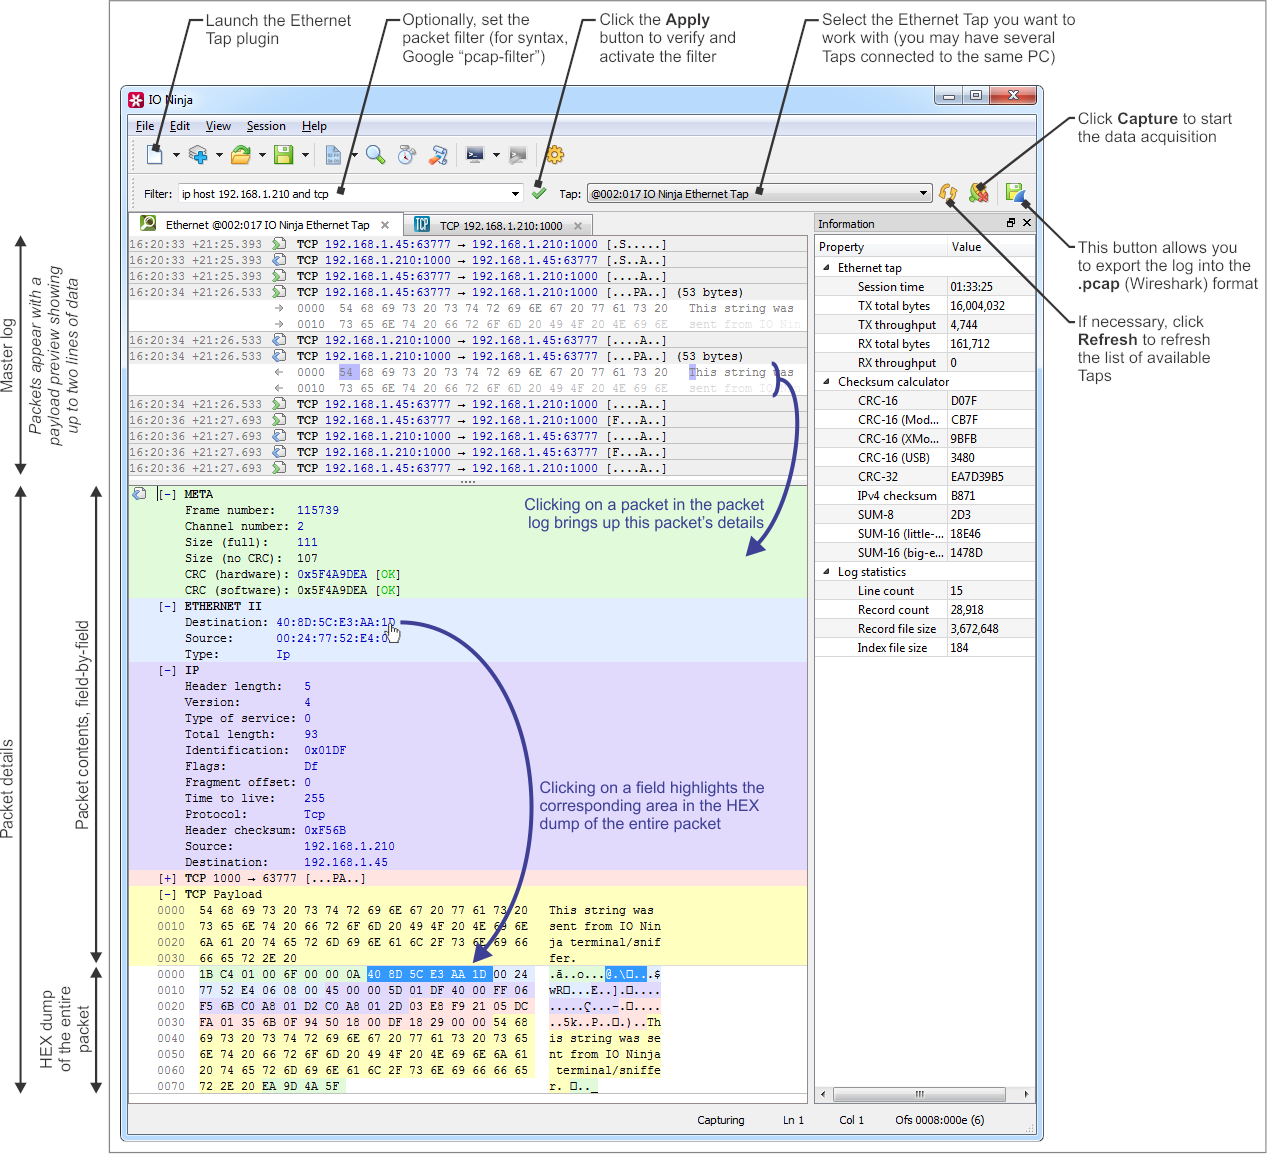
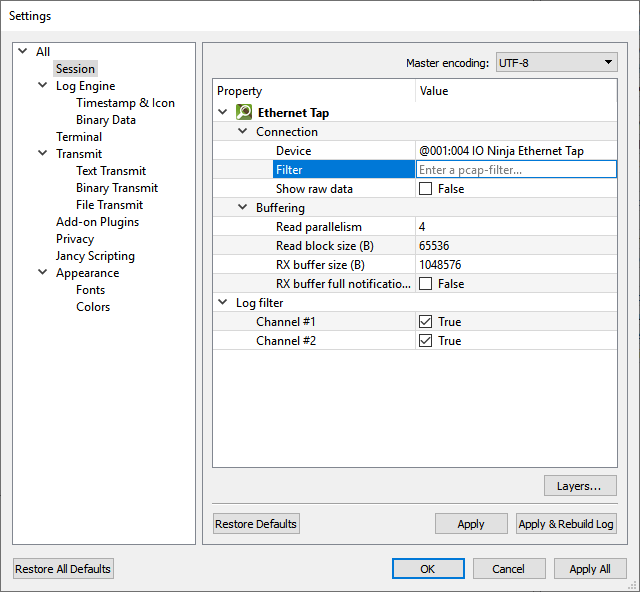
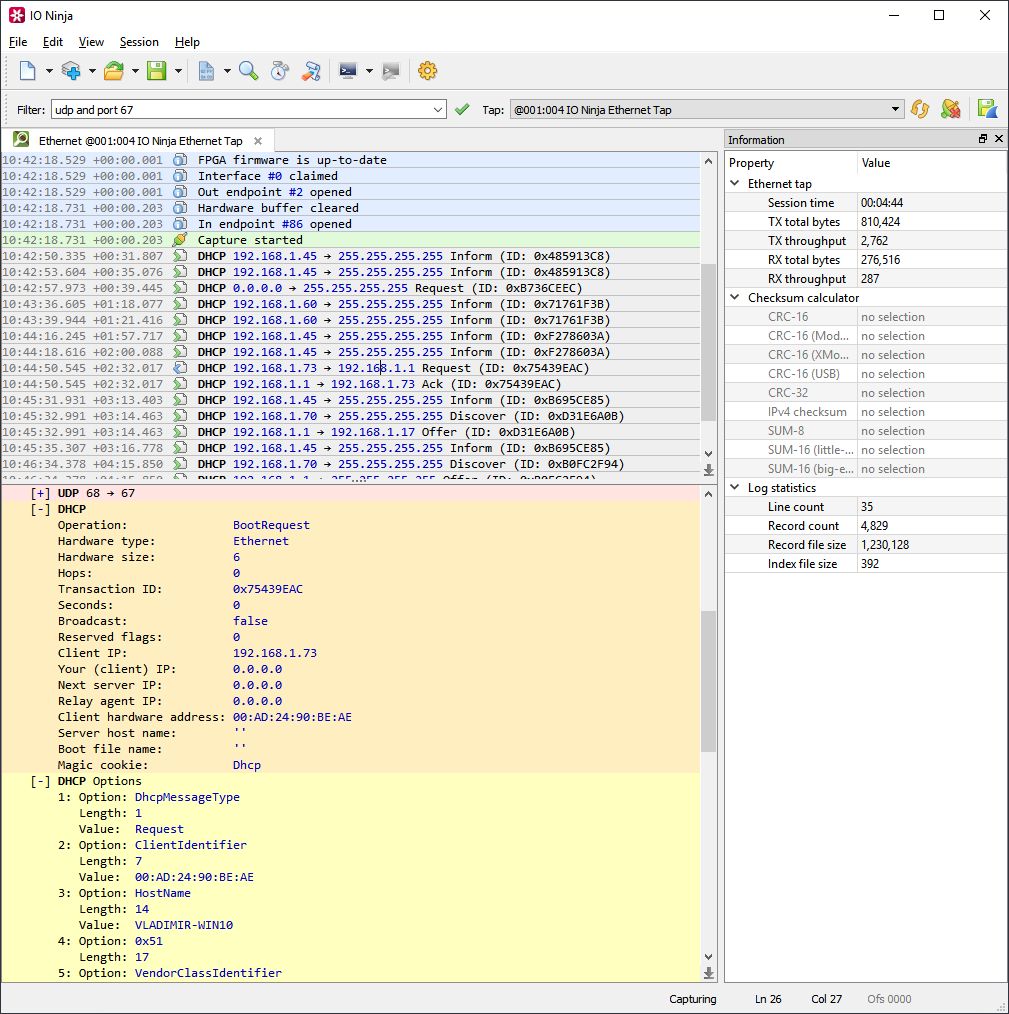
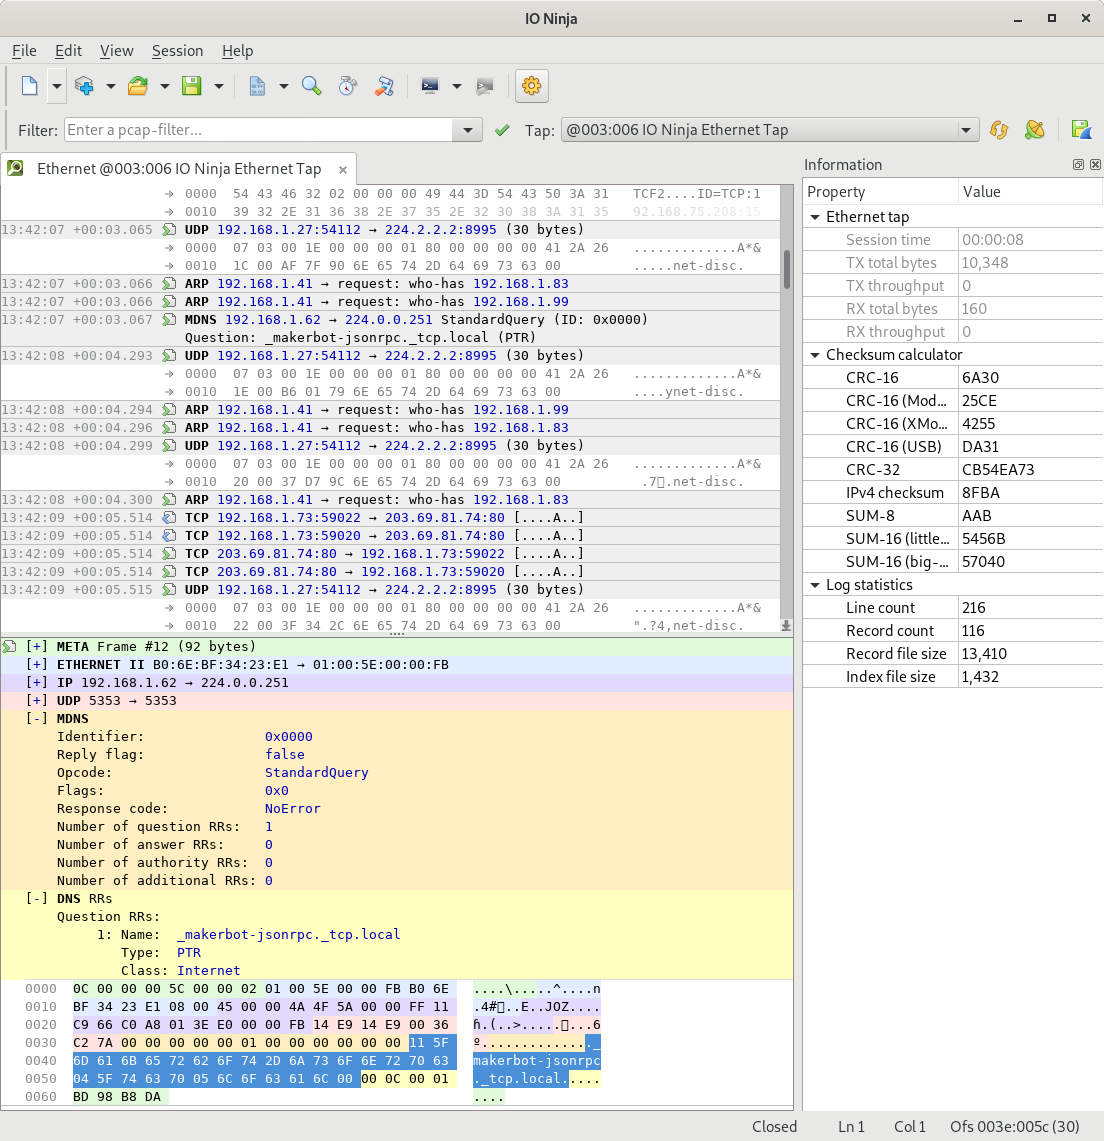
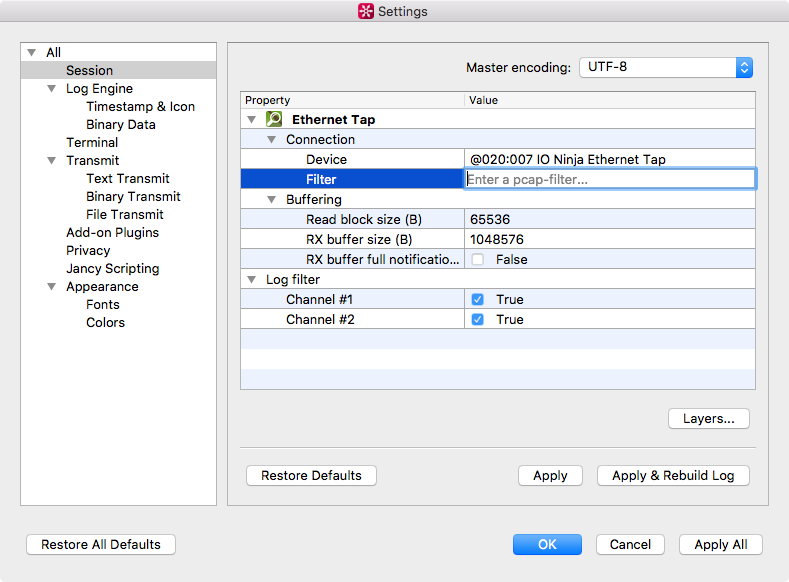
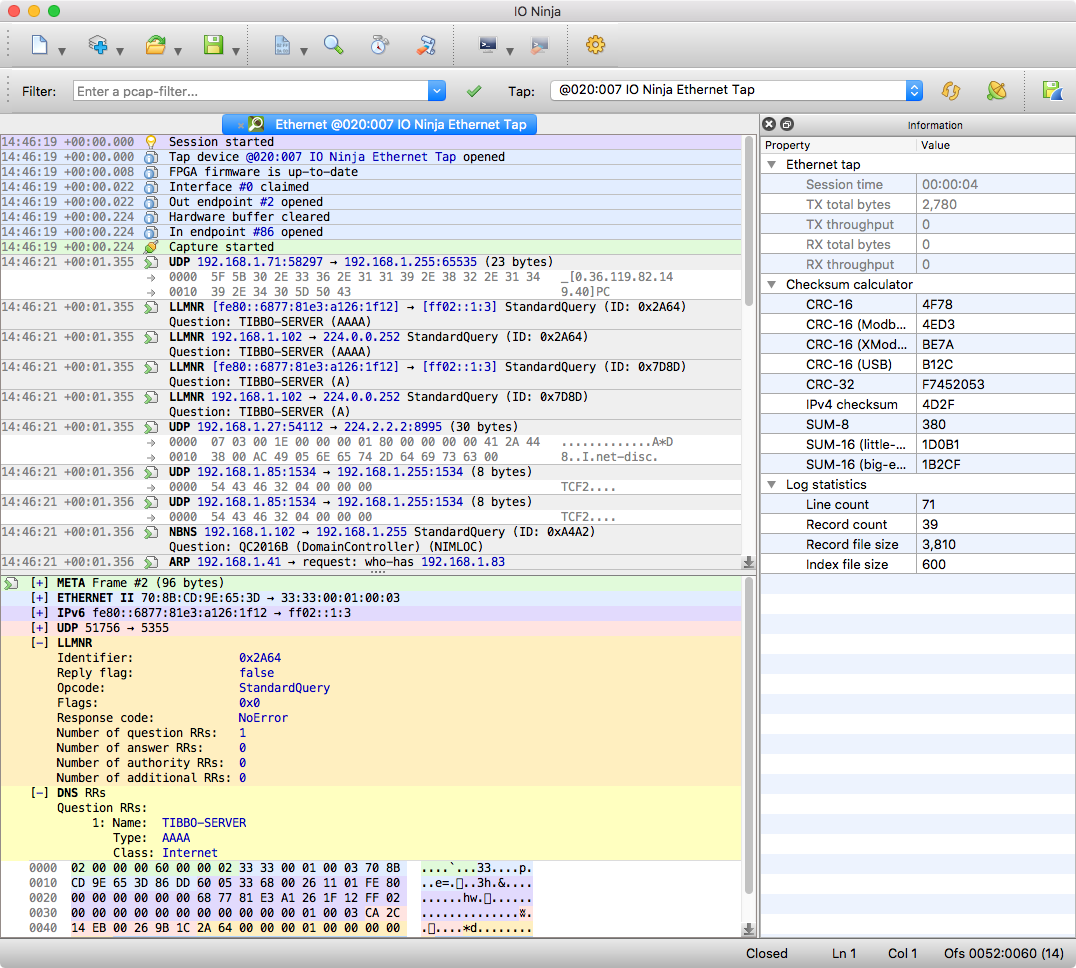
Open the Ethernet Tap plugin in IO Ninja and select a device in the Tap dropdown. Hit the Capture button, and you shall see all the packets on both RJ45 ports in real time. You can filter the packet list in the log at any time by entering a so-called pcap-filter in the Filter edit (click Apply to rebuild the log using the new filter). A complete reference on the filter syntax can be found at the official tcpdump manpage.
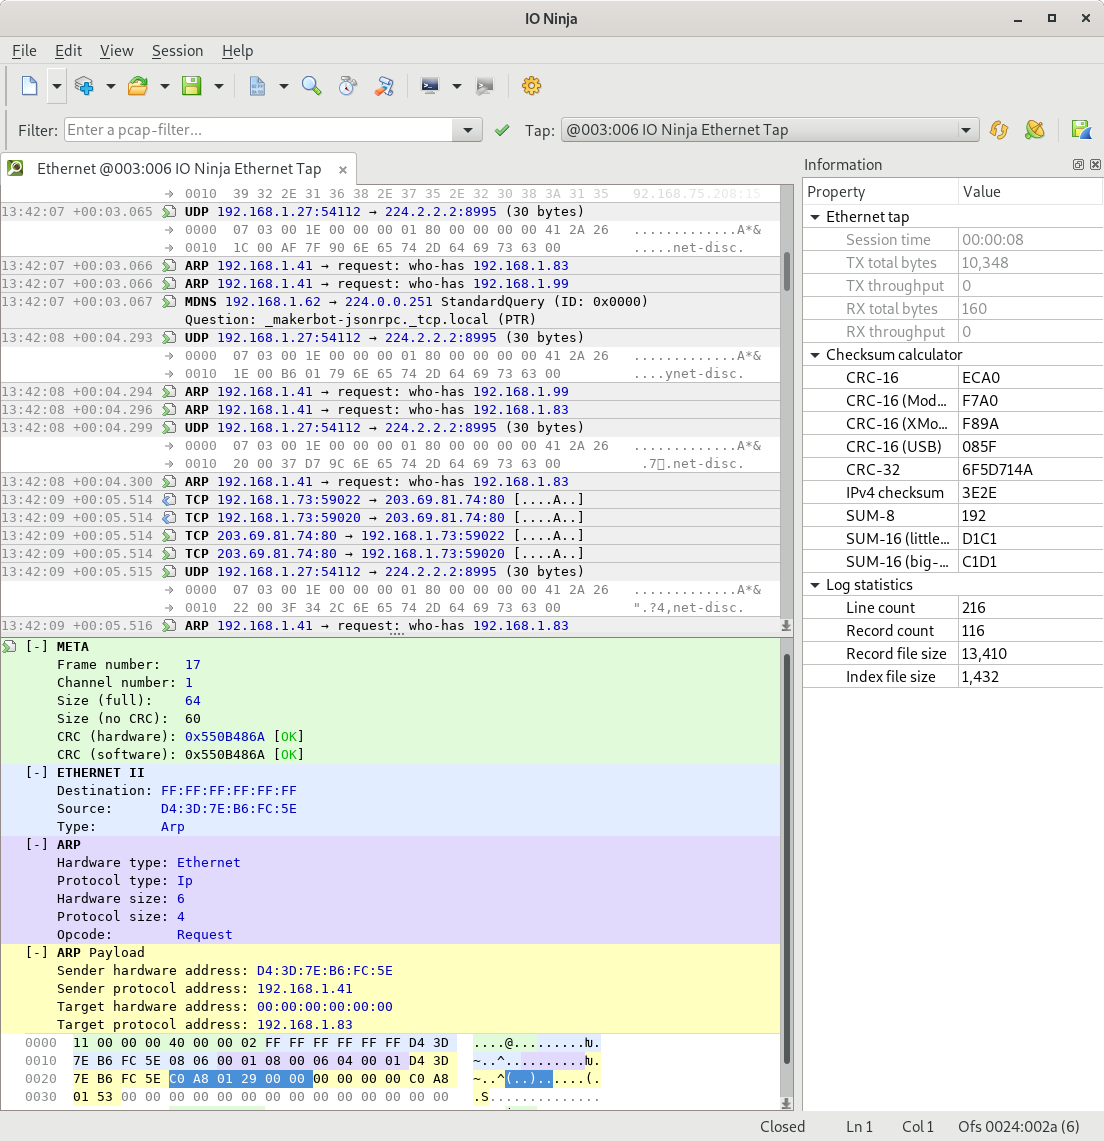
The Ethernet Tap plugin makes use of the new detail pane introduced in IO Ninja v3.12.0. The master log contains a list of packets (as well as other informational, warning, and error messages), a human-readable digest for each packet, and a two-liner payload preview. To inspect the raw contents of any packet, click on it in the master log, and the packet will be displayed in details in the pane below.
The color highlighting in the details pane helps you to visually distinguish between multiple protocols involved in the protocol stack for each particular packet. Clicking on any field automatically selects the corresponding region in the raw hex dump of a packet, thus making it easier for you to investigate the gory low-level details when you need to.
You can also export a log in the .pcap format for further analysis in other packet analyzers (such as Wireshark).
Remote Capturing
Starting with IO Ninja v5.1.0, it is possible to capture data with a Serial Tap device remotely. For more information, please navigate to the Serial Tap over SSH plugin page.
Live Capture With Wireshark
The ioninja-hwc utility introduced in IO Ninja v5.1.0 can be used to pass packets captured by your Ethernet Tap device to Wireshark in real time.
Windows
On Windows, you can start a pipe server as shown below:
> ioninja-hwc --ethernet-tap --pcap --named-pipe=ethernet-tap
Now, add \\.\pipe\ethernet-tap as a capturing interface to Wireshark:
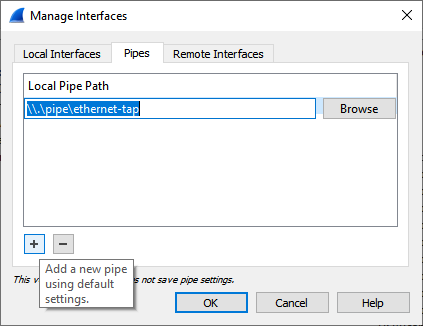
Now, you can start capturing on this interface the same way as you normally do with real network interfaces.
Linux or macOS
On Unix platforms, you can force ioninja-hwc to write the pcap stream into a FIFO file:
$ mkfifo ~/ethernet-tap-fifo
$ ioninja-hwc --ethernet-tap --pcap > ~/ethernet-tap-fifo
Now, add ~/ethernet-tap-fifo as a capturing interface to Wireshark and start capturing normally.
Documentation
| Resource | Description |
|---|---|
| Hardware Manual (HTML) | This is the Ethernet Tap chapter in the IO Ninja hardware manual. |
| Hardware Manual (PDF) | This is a PDF rendition of the above online HTML manual for downloading and printing. |
Gallery