Modbus Analyzer
Decode and Craft Modbus Frames with EaseTroubleshooting Modbus communication between masters and slaves is often frustrating. Raw Modbus frames are cryptic, making it hard to diagnose communication issues or verify correct exchanges in serial and TCP setups. Beyond interpretation challenges, manually crafting and sending Modbus packets for testing is tedious and prone to errors.
How IO Ninja Makes Modbus Easy
The Modbus Analyzer plugin makes Modbus communication easy to understand and test. By parsing and decoding Modbus RTU, Modbus ASCII, and Modbus TCP frames, it presents clear, human-readable insights alongside raw data. The plugin also lets you craft and send custom Modbus packets effortlessly, enabling precise control over read/write operations.
What Makes Modbus Analyzer so Great?
Stream Compatibility
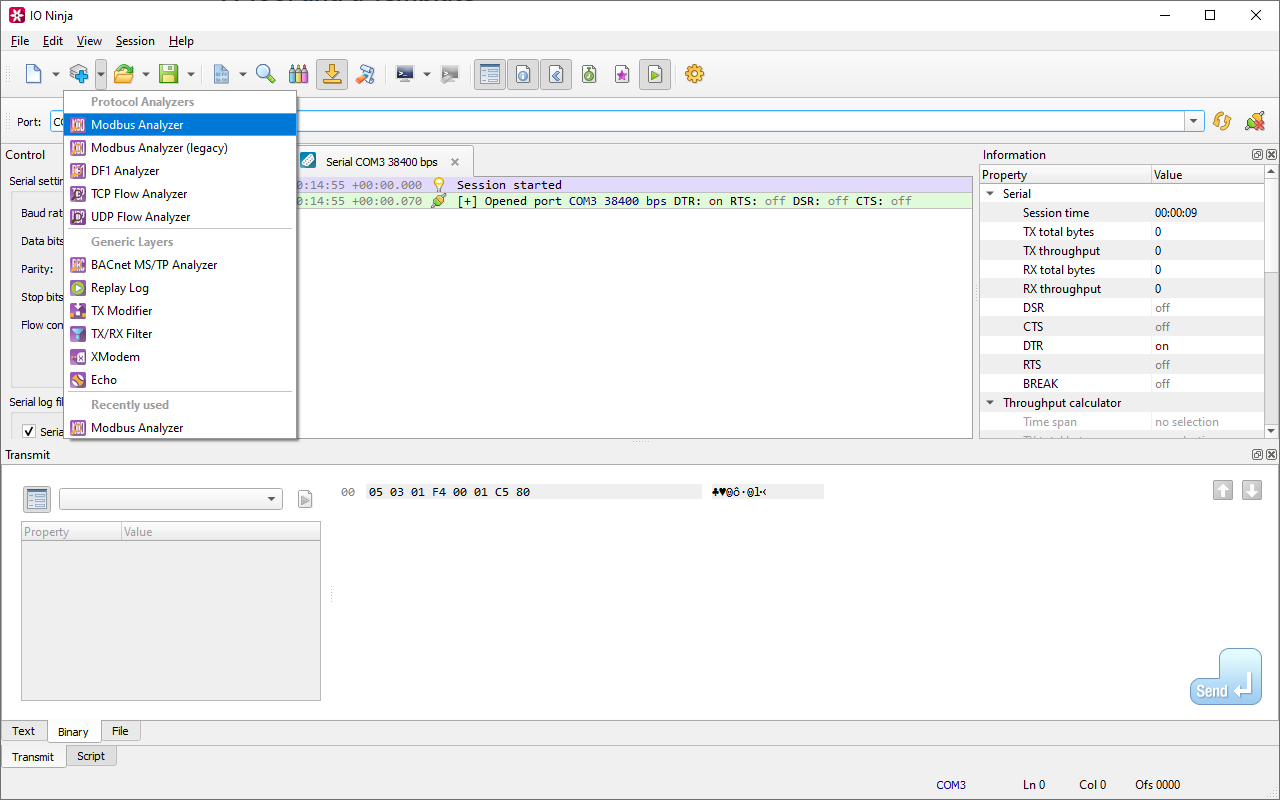
The Modbus Analyzer can be attached to any Serial or TCP-based stream session for analysis of Modbus RTU, Modbus ASCII and Modbus TCP frames traveling between a Modbus master and slave(s).
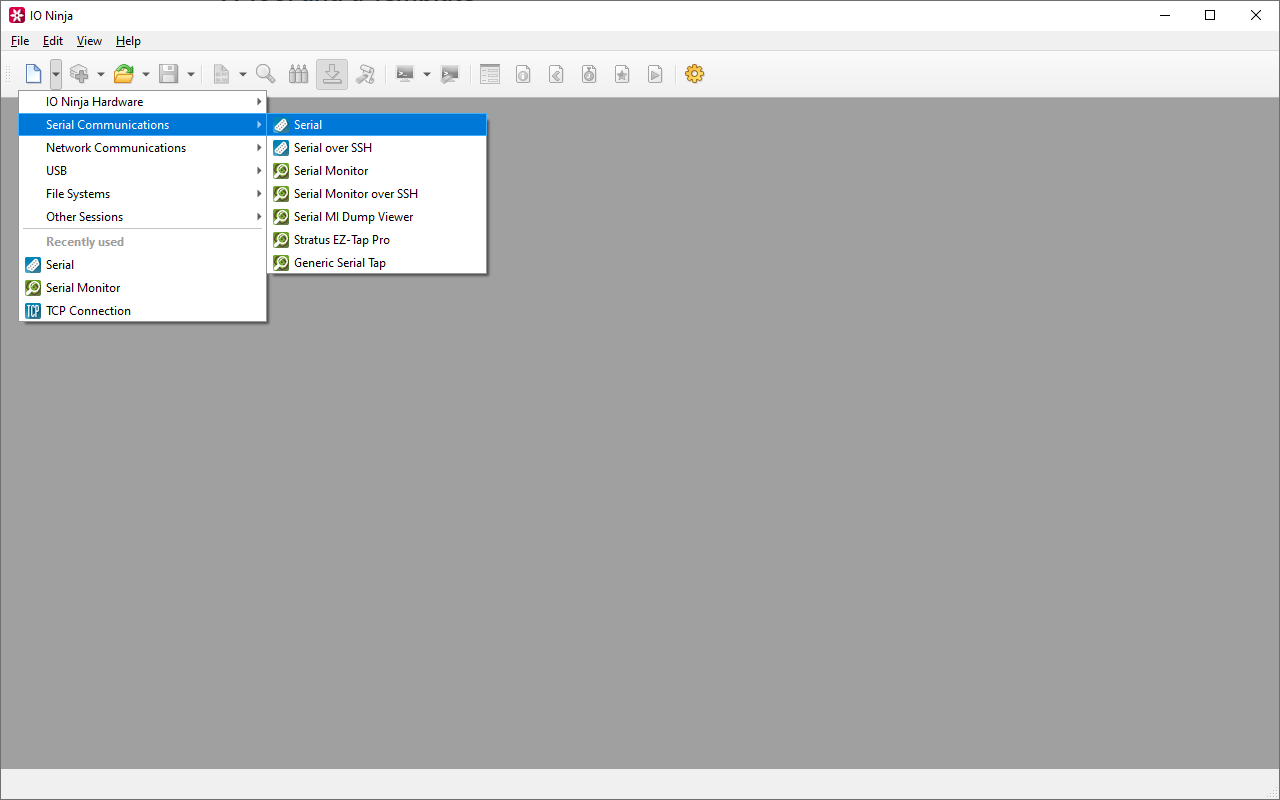
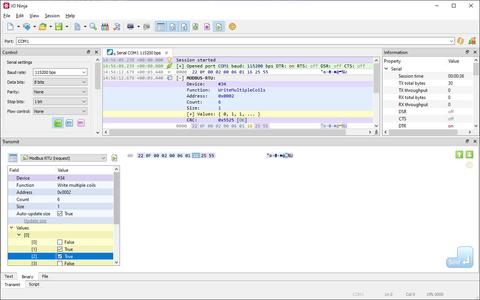
- Serial Monitoring: Monitor Modbus RTU and ASCI over RS-232 or RS-485 with plugins such as Serial Monitor and Serial Terminal. You can even monitor and analyze remotely with Serial Over SSH.
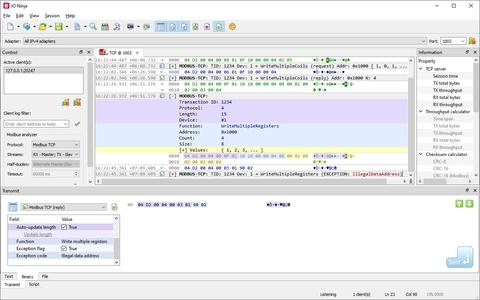
- TCP Sessions: Analyze Modbus TCP flows using tools like TCP Proxy or TCP Flow Monitor.
Modbus Analyzer also works with hardware taps, such as IO Ninja's Serial Tap and thid-party tap EZ-Tap Pro.
Real-Time Decoding
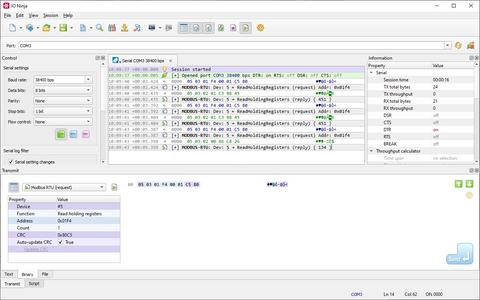
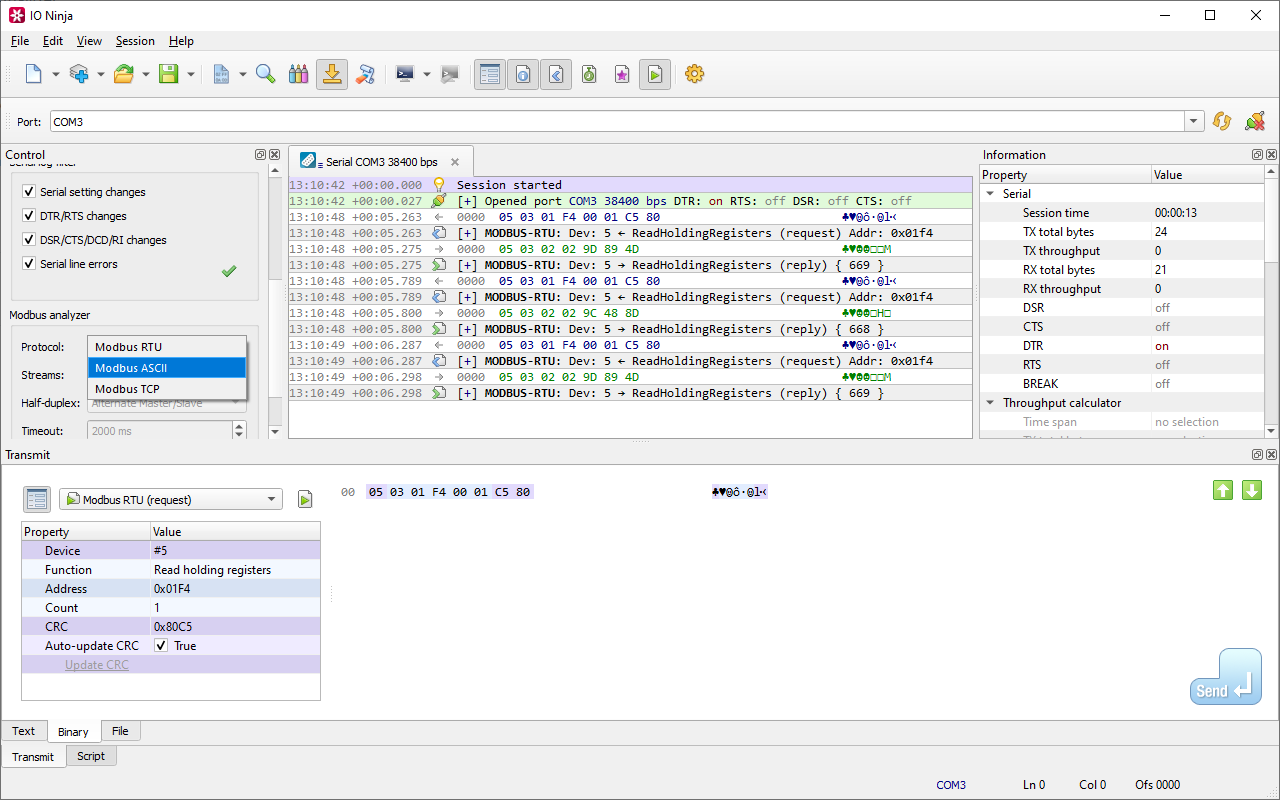
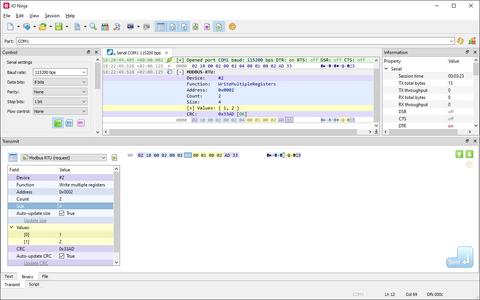
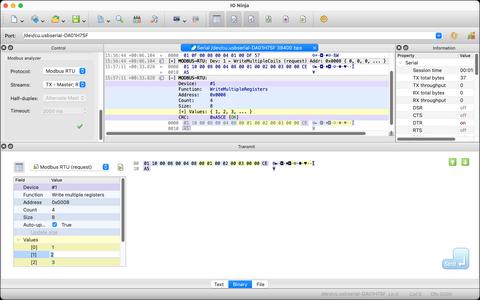
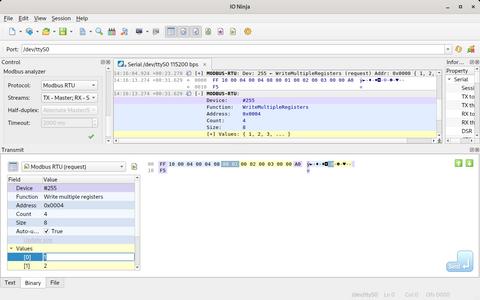
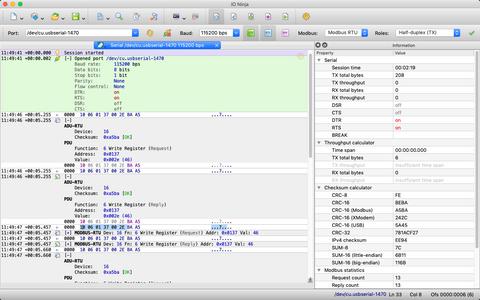
When Modbus frames are detected, the analyzer displays decoded, human-readable messages in the log next to the original data bytes. This dual display ensures:
- Complete transparency, with no loss of information.
- Flexibility to detach the analyzer and revert to raw, unprocessed data streams.
This seamless integration allows you to examine the protocol at multiple levels of detail.
Advanced Packet Transmission
Need to send your own Modbus packets? Modbus Analyzer can help you craft and transmit Modbus packets. This is especially useful for reading registers or writing data to Modbus devices.
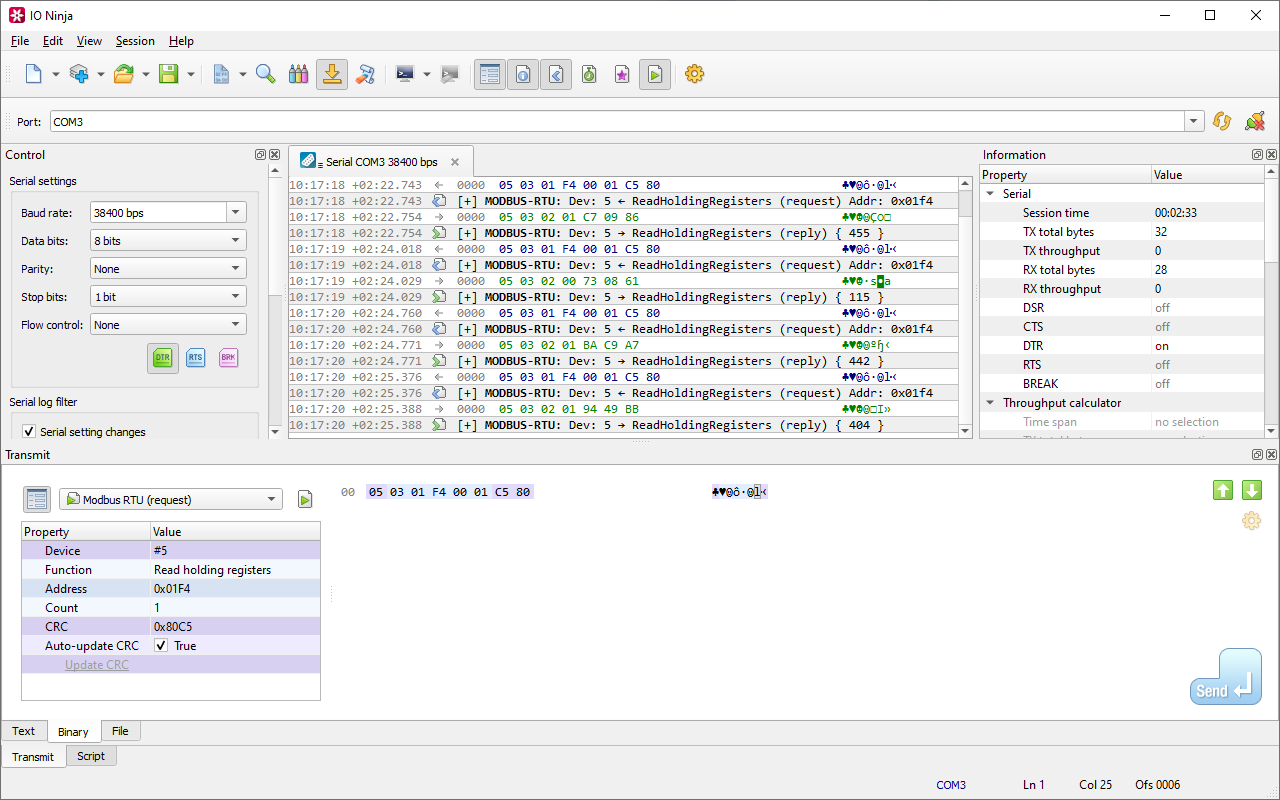
With the Modbus Analyzer, you can emulate a master or a slave device. The layer provides a user-friendly UI for creating Modbus packets, while also allowing you to modify each and every byte in your packet. It dynamically builds the packet for you and auto-calculates the CRC. This feature is extremely useful for injecting intentional errors to test the reliability of your devices and protocols.
Configurable Protocol Modes
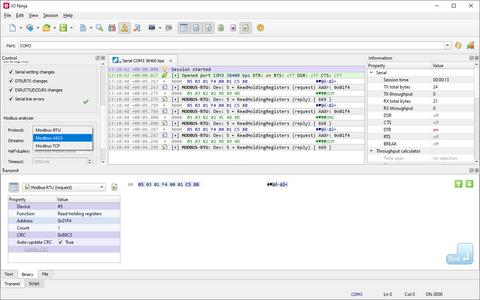
The analyzer supports Modbus RTU, Modbus ASCII, and Modbus TCP. You can switch between these modes using the Protocol setting in the analyzer’s configuration panel.
Additionally, roles like Master and Slave can be reassigned dynamically through the Stream Roles setting. This flexibility ensures compatibility with a wide range of Modbus setups and testing scenarios.
Powerful & Beautiful Logging Engine
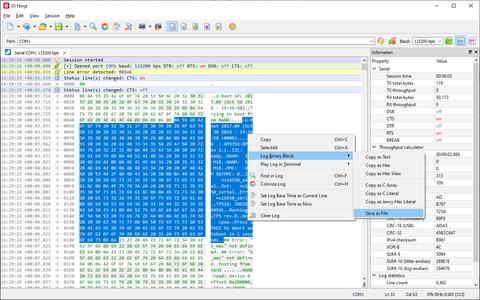
The Ninja Scroll logging engine is the heart of IO Ninja! It offers many unique and useful features you won't find in other Modbus analyzers, such as interleaving binary data with informational messages for a clear timeline of events, switching between hex-view and plain-text view of binary data, a regex markup engine for highlighting data based on regular expressions, and many others!
Scriptability
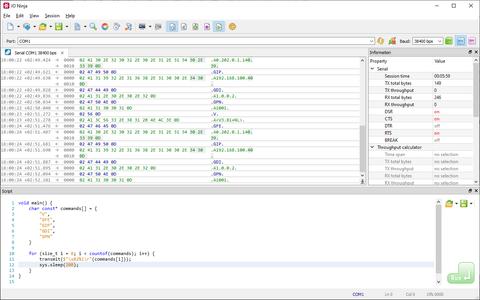
With the Script Pane, you can generate Modbus packets programmatically, wait for and react to Modbus events, and automatically reply to incoming data, etc.
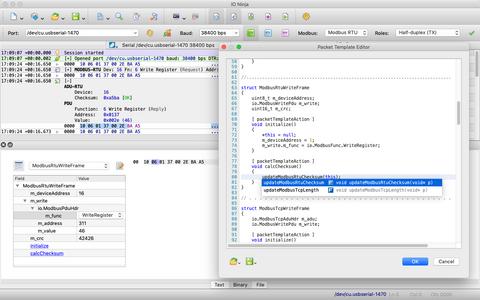
For more complex binary packets, you can describe the structure and methods for updating checksums or other auto-calculated fields as a Packet Template, then conveniently fill in the fields in a property grid.
Getting Started
Half-Duplex RS485 Setup
Modbus Analyzer is capable of monitoring half-duplex RS-485 communication, although setup is a little bit more complex. We have a detailed knowledge base article to guide you through the setup process step by step.
Documentation
| Resource |
|---|
| Modbus Analyzer Documentation in the IO Ninja User Manual |
| Monitoring Modbus over Half-Duplex Serial Links |
See Also
| Plugin | Relevance |
|---|---|
| Capture serial Modbus traffic using our versatile hardware sniffer. | |
| Talk to serial Modbus devices attached to your workstation. | |
| Captrue serial Modbus traffic generated by other apps on your workstation. | |
| Connect to remote Modbus devices over TCP. |
