Modbus Analyzer
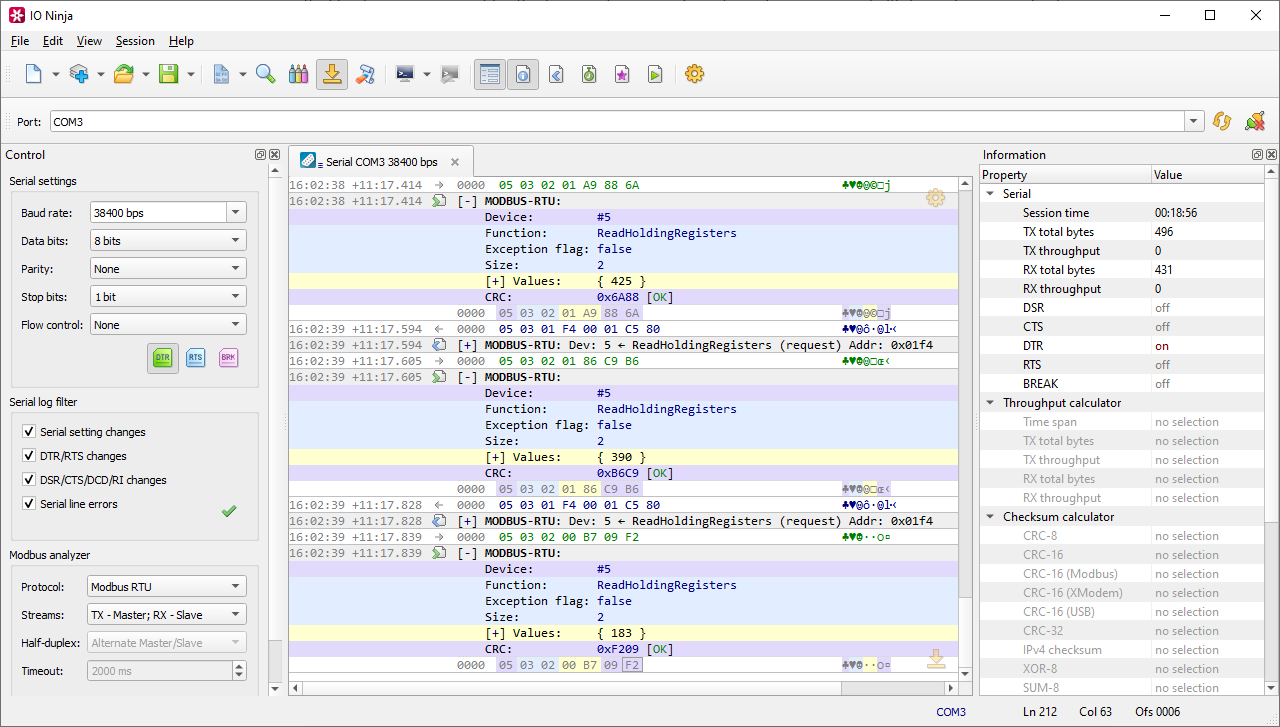
The Modbus Analyzer plugin makes Modbus communication easy to understand and test. By parsing and decoding Modbus RTU, Modbus ASCII, and Modbus TCP frames, it presents clear, human-readable insights alongside raw data. The plugin also lets you craft and send custom Modbus packets effortlessly, enabling precise control over read/write operations.
Basic Setup
Ensure your serial device is connected to the computer that is running IO Ninja.
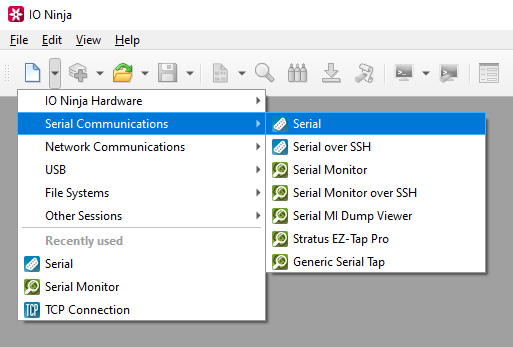
In IO Ninja, click the “New Session” dropdown and select a session type, e.g., “Serial”.
If not selected automatically, select your serial device from the “Port:” dropdown.
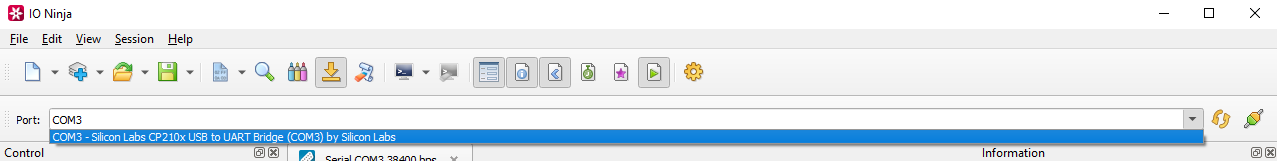
Open the port by clicking the “Open” button located to the right of the “Port:” dropdown.

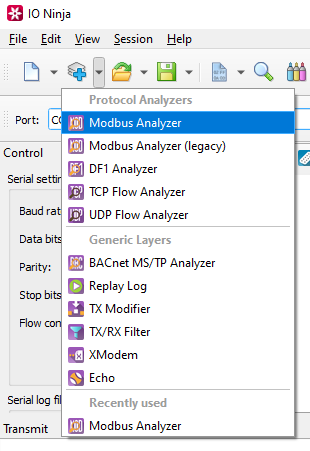
Click the “Layer Pipelines” dropdown and select “Modbus Analyzer”.
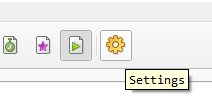
Adjust settings as needed via the “Settings” button (see “Settings” section below for details).
Note
For Half-Duplex monitoring, you may wish to consult the “Half-Duplex Setup” section.
Half-Duplex Setup
Half-duplex Modbus communications are not easy to parse due to the packet format specifics. Alas, the Modbus protocol doesn’t define any structural differences in headers of requests and replies – request and replies start with exactly the same sequence of bytes (which in case of a reply usually followed by extra data bytes). In full-duplex links, it doesn’t impose a problem – TX data always contains Master requests, RX – Slave replies. But in half-duplex everything is mixed into a single stream of bytes. Therefore, some heuristics is needed to split this single byte stream into two.
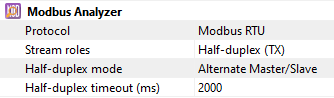
Go to “Settings”
Set “Stream roles” to “Half-duplex (RX)” or “Half-duplex (TX)”, so that Modbus Analyzer knows that Modbus requests and Modbus replies are all contained in the single stream (RX or TX)
Set the “Half-duplex mode” based on your needs (see “Settings” section below for details)
Note
There is also a dedicated Knowledge Base page explaining this.
Modbus Sniffing
After basic setup is complete, you can begin to sniff Modbus communications.
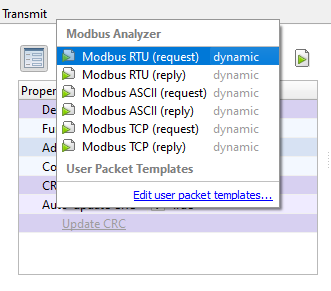
Packet Generation
In the “Packet Template” pane, select either request or reply and
RTU,TCPorASCII.
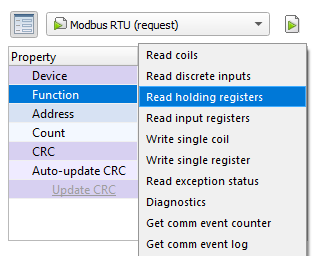
Edit property values, e.g. “Function” or “Count”.
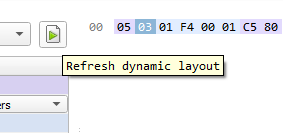
Click the “Refresh dynamic layout” button to generate the Modbus binary.
Click the “Send” button and watch as you get human-readable Modbus responses.
Settings
Setting |
Description |
Default |
|---|---|---|
Protocol |
Specify the Modbus flavor. See available options. |
Modbus RTU |
Stream roles |
Assign Master/Slave roles to captured data streams. See available options. |
TX - Master; RX - Slave |
Half-duplex mode |
Half-duplex Modbus is tricky to decode. This setting allows you to choose a proper heuristic for the Modbus decoder. See available options. |
Alternate Master/Slave |
Half-duplex timeout |
When Half-duplex mode is set to Alternate Master/Slave, this setting defines a timeout (in milliseconds) after which the decoder decides there was no reply from a Slave and switches back to Master. |
2 sec |
Modbus Sub-protocols
Protocol |
Description |
|---|---|
Modbus RTU |
The most commonly used version of Modbus over Serial links. |
Modbus ASCII |
Closely resembles Modbus RTU but uses only ASCII characters for communication, thus making it possible to transfer over 7-bit links (and somewhat easier to debug). |
Modbus TCP |
A version of Modbus used over TCP connections. |
Stream Roles
Role |
Description |
|---|---|
TX - Master; RX - Slave |
Master and Slave(s) use different data streams. The Master’s commands are in the TX stream; the Slave(s)’ replies are in the RX stream. |
RX - Master; TX - Slave |
Master and Slave(s) use different data streams. The Master’s commands are in the TX stream; the Slave(s)’ replies are in the RX stream. |
Half-duplex (TX) |
Master and Slave(s) use the same data stream – TX. |
Half-duplex (RX) |
Master and Slave(s) use the same data stream – RX. |
Half-duplex Modes
Mode |
Description |
|---|---|
Alternate Master/Slave |
The analyzer alternates the roles dynamically based on the traffic. |
RTS ON - Master, else Slave |
When the RTS signal is ON (active), the analyzer treats the packet as originating from the Master. If RTS is OFF, the packet is treated as originating from the Slave. |
RTS ON - Slave, else Master |
When the RTS signal is ON (active), the analyzer treats the packet as originating from the Slave. If RTS is OFF, the packet is treated as originating from the Master. |
CTS ON - Master, else Slave |
When the CTS signal is ON (active), the analyzer treats the packet as originating from the Master. If CTS is OFF, the packet is treated as originating from the Slave. |
CTS ON - Slave, else Master |
When the CTS signal is ON (active), the analyzer treats the packet as originating from the Slave. If CTS is OFF, the packet is treated as originating from the Master. |
FAQ (Frequently Asked Questions)
1. How can I monitor Modbus TCP comms between Master (e.g. HMI) and Slave devices?
IO Ninja supports monitoring Modbus TCP using two main methods:
TCP Proxy: If you can configure the Master to connect through IO Ninja, use the TCP Proxy plugin to sit between the Master and Slave. This allows IO Ninja to intercept and log the communication directly.
Pcap Sniffer: If proxying is not possible, use the Pcap Sniffer to capture packets from the network. This may require additional setup, especially if IO Ninja is not running on the same host as the Master.
Once captured, attach Modbus Analyzer to decode raw packets into readable Modbus frames.
2. How can I export Modbus data from IO Ninja for use in data acquisition (DAQ) systems?
IO Ninja doesn’t integrate with DAQ systems, but you can export captured data in two ways:
Save as .njlog: Export your session log and process it using any scripting language. The
.njlogformat is simple, and its structure is defined in thescripts/api/log_RecordCode.jncandlog_RecordFile.jncfiles included with IO Ninja.Custom Log Layer: If needed, create a script-based Log Layer to transform data in real time. This option is best for users familiar with IO Ninja scripting.