2025-10-31
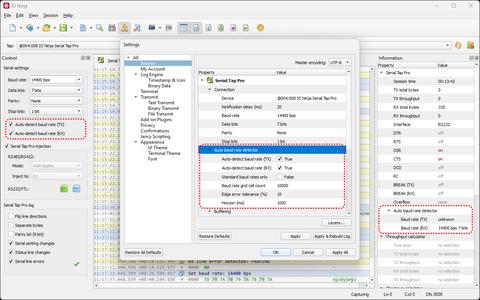
- NEW: Automatic Baud Rate detection (aka ABR) in Serial Tap Pro
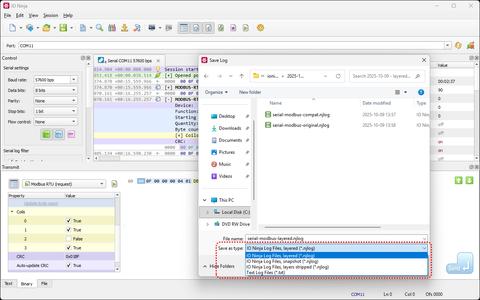
- NEW: Layered log files for decomposition of saved logs in Modbus Analyzer and other layer plugins
- NEW: Dynamic attributes and dynamic bitfields in Jancy
dylayoutdeclarations - Checksum calculator now works in Transmit Pane too
- Automatic multi-staged recalculation of dynamic layouts in Packet Templates
- Ethernet Tap, Pcap Sniffer, and other plugins with a Detail Pane now highlight current packet in the main log view
- Numerous critical fixes in various modules
Automatic Baud Rate Detection
At the time of its release few months ago, Serial Tap Pro was already the most advanced serial solution on the market. And now it has become even better with the addition of Automatic Baud Rate detection (ABR).
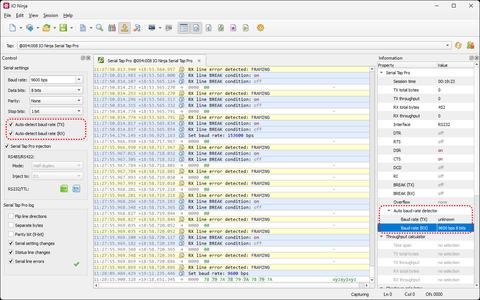
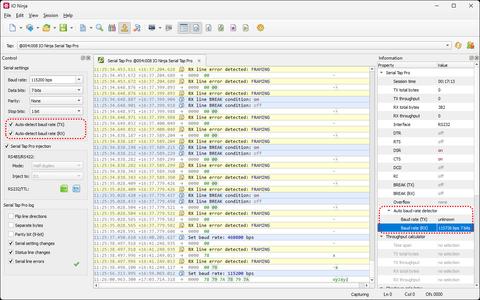
Unlike most other ABR-enabled products out there, our baud rate detector doesn't rely on specific byte patterns to do its job. Just a few random bytes captured on the wire — and voila! The detected serial parameters will instantly appear in the Information Pane on the right, so that you can adjust tap settings accordingly. Or not — our detector is non-intrusive by design; it merely offers a hint, and it's up to you to take it or leave it.
Last but not least, our ABR continues to work even when two devices on the serial link are using two different baud rates — a super common cause of serial communication errors! With Serial Tap Pro, you'll spot such mismatches immediately, saving you minutes (or hours!) of head scratching.
Layered Log Files
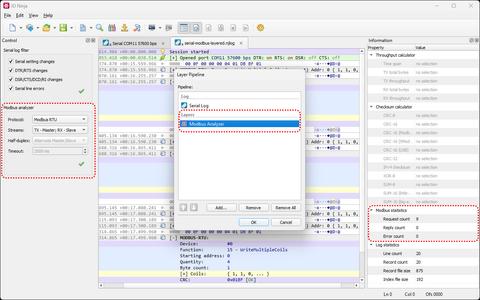
Layer plugins can work with any underlying transport. For instance, Modbus Analyzer can work with any serial-based session (e.g., Serial Monitor, Serial Tap Pro, etc), and TCP-based sessions (e.g., TCP Connection, TCP Server, etc), and even on top of another layer stack (e.g., Ethernet Tap → TCP Flow Monitor). This makes layers extremely flexible and versatile.
Until now, if you saved a log of such a stack and sent it to colleagues, they would only receive a static snapshot of what you saw. For instance, they wouldn't be able to detach the analyzer layer and return to the original log. This wasn't a huge problem, but it was a limitation nevertheless.
With this release of IO Ninja that limitation is gone. Please welcome layered logs — logs that carry information about the layer stack and run all the analyzers dynamically to produce the final representation on the fly. With layered logs, you can work with your log just like it's a live session — change parameters and re-parse the log, reorder layers in the stack, or even drop all layers to return to the original raw log.
And don't worry, the old "snapshot" mode of saving a log generated by a layer is still available.
Dynamic Attributes & Dynamic Bitfields
Jancy attributes are widely used throughout IO Ninja scripts to map human-readable descriptions to packet header fields and constants, assign fonts and colors to packet sections, change data formatting rules, and so on.
But there's a catch. Attributes in Jancy are evaluated at compile time and are therefore inherently constant. You can't calculate a value at run time and then assign it to an attribute within a declaration. For instance, the following wouldn't work:
[ myAttr = rand() ] // error: non-constant used as an attribute value
struct S { /* ... */ }
Jancy dynamic layouts — the workhorse of packet templates and protocol analyzers — are, on the other hand, computed at run time by design; all declarations inside a dylayout statement are essentially dynamic. As such, it makes sense to allow non-constant attributes in dynamic layouts as an exception:
jnc.DynamicLayout layout(packet, size);
dylayout (layout) {
    dyfield uint16_t command;

    [
        name = getCommandName(command),   // it's now OK to calculate
        color = getCommandColor(command)  // dyfield attributes at runtime!
    ]
    dyfield group {
        // ...
    }
}
Another novelty is the introduction of dynamic bitfields. Jancy has long supported C-like bitfields (e.g., uint8_t bitfield : 2;) inside struct and union declarations — but now you can declare bitfields inside dylayout statements too! This makes it possible to describe bit-perfect dynamic layouts!
jnc.DynamicLayout layout(packet, size);
dylayout (layout) {
    dyfield uint8_t size : 6; // 6-bit data size in bits...

    // ...immediately followed by tightly packed data bits...

    for (size_t i = 0; i < size; i++)
        dyfield uint8_t bit : 1;

    dyfield uint8_t crc4 : 4; // ...and terminated by a 4-bit checksum
}
These two tweaks make dynamic layouts in Jancy even more powerful, enabling a more natural and intuitive design of packet templates and protocol analyzers.
Other Packet Template Improvements
Previously, changing a field in a packet template based on dynamic layout could require multiple clicks on the "Update dynamic layout" button. Imagine, the new value of a packet field dictates a packet size larger than what we have now (1st recalculation), then newly added packet fields alter the internal structure of the packet (2nd recalculation), then autorun methods update packet length once again (yet another recalculation), and so on.
Now, a single click on "Update dynamic layout" will take care of this whole chain-reaction of recalculations automatically, sparing you from repeated (and rather annoying) manual updates. And speaking of annoyances, autorun methods will no longer suddenly change the field you're editing (a quirk that used to happen when two fields were edited in quick succession).
Checksum Calculator in Transmit Pane
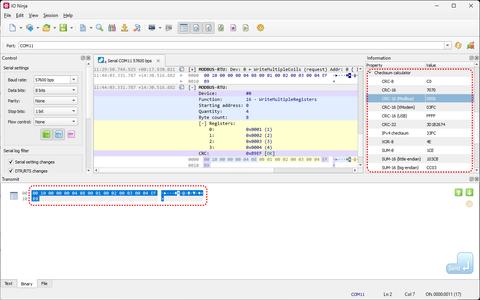
Checksum calculator was one of users' favorite features ever since its debut back in v3.8.5. All you have to do is select a data range in the log, and the information pane on the right will instantly display all standard checksums, calculated automatically in the background. With a bit of scripting, you can even add your own custom checksum algorithms!
This feature was designed to work with the log view only, but some users wondered — shouldn't IO Ninja also calculate checksums when selecting ranges in hex editor in the Transmit Pane? This could be quite useful when crafting tricky binary packets! The answer is — YES, absolutely! It should have, and now it does!
While the log and the hex editor are very different beasts, the Checksum Calculator now handles both equally well. A well-deserved toast to yet another feature rightfully called for by our users!
Plugins with Detail Pane Now Highlight Current Packet
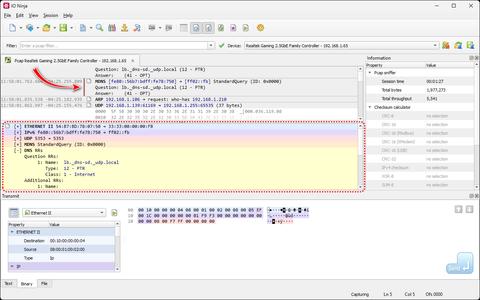
IO Ninja features a Detail Pane that displays in-depth information about a packet currently selected in the main log view. You click on a packet in the main log, and its contents are instantly revealed in the Detail Pane in all their glorious details. This feature is utilized by packet-based sessions — Ethernet Tap and Pcap Sniffer.
The selection in the main log, however, was way too subtle! Once you clicked a packet, there was almost no visual clues in the main log to show which one was being displayed in the Detail Pane — just a tiny caret! You needed eagle eyes to spot it — and even those wouldn't help if you shifted focus to another widget!
Starting with this release, the main log now highlights the current packet with a clear and unambiguous visual mark making it easy to see which entry the Detail Pane refers to. This indicator updates automatically regardless of the method used to change the selection — keyboard, mouse, "Find" dialog, etc.
Other Critical Fixes
- Missing FPGA uploader error reports
In FPGA-based plugins, the firmware uploader failed to report flash-write errors. While this issue never affected our users (such errors are exceptionally rare, and even if one occurred, the firmware would fail to start due to checksum verification) — it was still a critical bug. Fixed now.
- Opportunistic crash in detail log pane
Dragging a selection range in the Detail Pane when the "stick-to-bottom" mode in the main log was on and new packets kept rapidly arriving, could in rare cases cause an opportunistic crash caused by a use-after-free while canceling the checksum calculation process. Fixed now.
- False-positive BREAK condition change reports in Serial Tap Pro
Serial Tap Pro line change notifications would cause IO Ninja to incorrectly report BREAK conditions on both TX and RX lines as switching to OFF — even when BREAK was still ON. Fixed now.
- ...and many others
For a complete list of changes, see changelog.txt (also included in all installation packages).
