TCP Flow Monitor
The TCP Flow Monitor plugin provides an elegant way to see just the data and nothing else. Specify an interface to capture packets on, specify a filter in the form of address (or just port) and forget about packets! You will receive a clean log of data exchange reconstructed from the captured packets behind the scene - and in real time (no capture-first-re-create-conversation-later). The end result will look just like the one you see in TCP Connection plugin or TCP Listener plugin.
Basic Setup
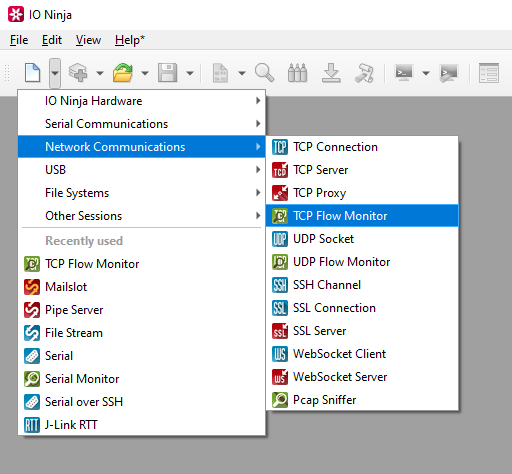
In IO Ninja, click the “New Session” dropdown and select “TCP Flow Monitor”.
In the “Filter:” field, type a capture filter, e.g. “8080” (to capture traffic on port 8080).
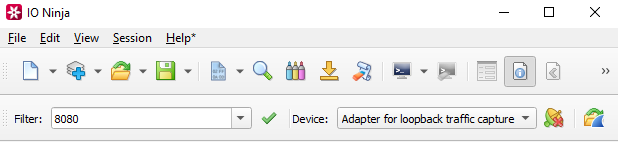
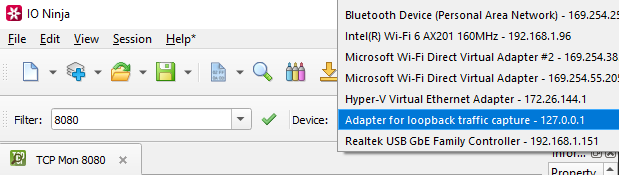
Select a network interface from “Device:”, e.g. “Adapter for loopback traffic capture”.
Click the “Capture” button to the right of the “Device:” dropdown to start capturing traffic.

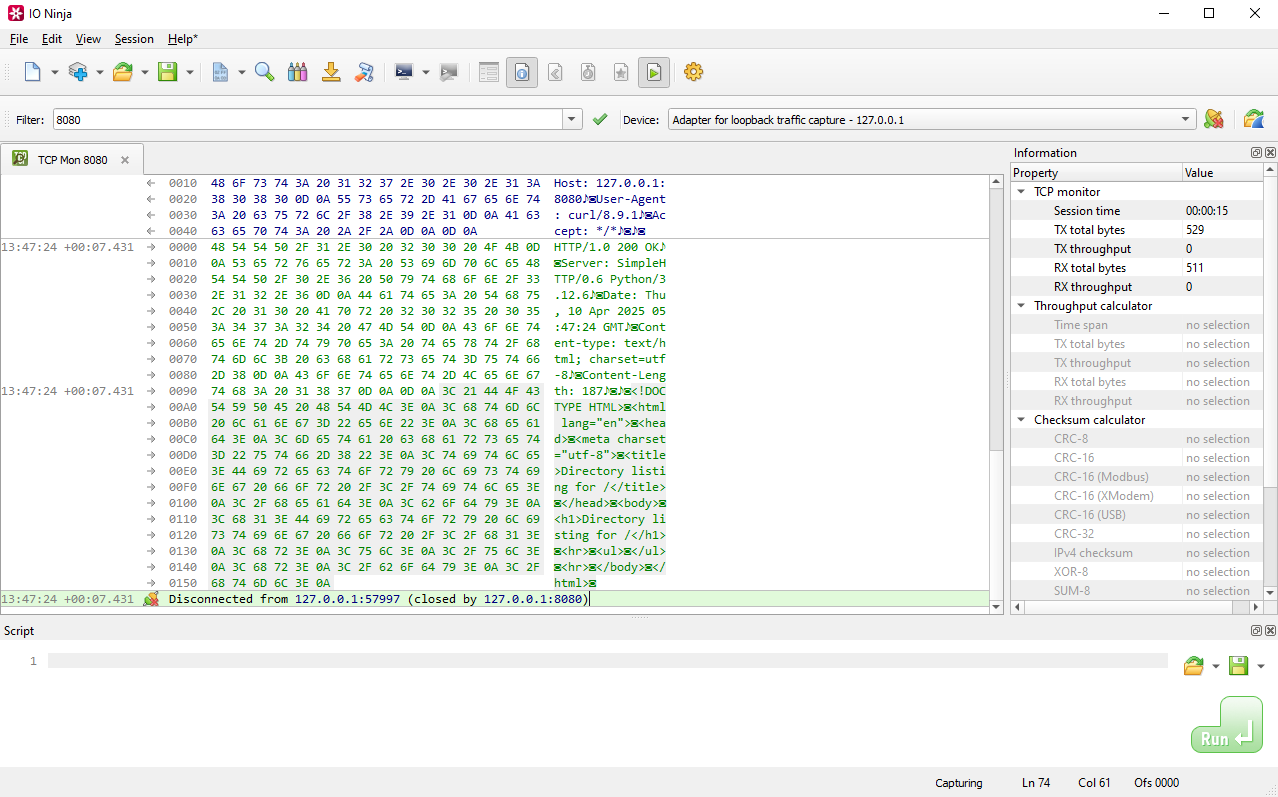
Monitor TCP traffic captured according to your filter.
Adjust settings as needed via the “Settings” button (see “Settings” section below for details).
Settings
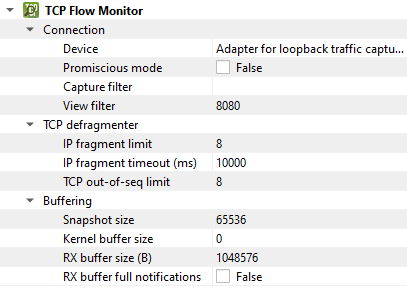
Setting |
Description |
Default |
|---|---|---|
Device |
The device to capture. |
|
Promiscious mode |
Intercept and analyze all network traffic, not just the data specifically directed to it. |
False |
Capture filter |
Term to filter with when capturing packets. |
|
View filter |
Term to filter with when displaying packets. |
|
IP fragment limit |
The maximum number of IP fragments. IP fragments refer to the pieces of a larger IP packet that has been broken up for transmission across a network. |
8 |
IP fragment timeout (ms) |
The maximum delay between IP fragments. |
10000 |
TCP out-of-seq limit |
Maximum number of out-of-order TCP segments. |
8 |
Snapshot size |
Pcap (packet capture) snapshot size. |
65536 |
Kernel buffer size |
Pcap (packet capture) kernel buffer size. |
0 |
RX buffer size (B) |
The full size of the incoming data (RX) buffer. Affects read throughput. |
1048576 |
RX buffer full notifications |
Toggle warnings in log about the incoming data (RX) buffer getting full. |
False |