Ethernet Tap
Note
This page is for the Ethernet Tap Tap plugin. For the board, see the hardware docs.
The Ethernet Tap is a hardware sniffer for monitoring Ethernet traffic flowing through a single Ethernet connection. The Tap passes the Ethernet traffic through with a delay equal to about 5.2uS. Use this plugin to monitor all its communications through the IO Ninja application.
Basic Setup
In IO Ninja, click “New Session” and select a new “Ethernet” session.
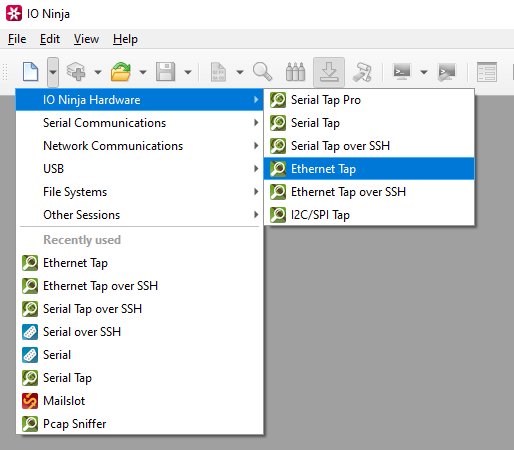
If not selected automatically, select your Ethernet Tap from the “Tap:” dropdown.

Note
If you can’t see your tap, press the “Refresh” button.
Click the “Capture” button to the right of the “Tap:” dropdown to start monitoring.
Analyze the log as needed.
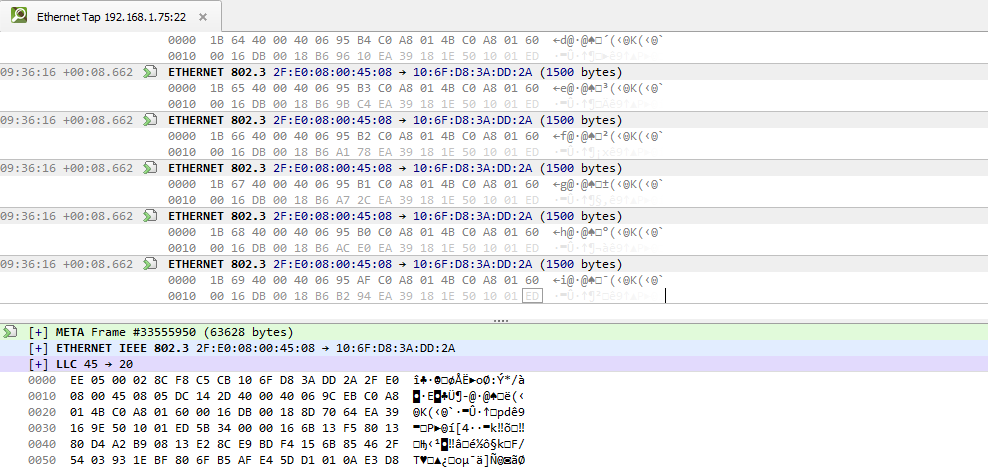
Export to a .pcap file by pressing the “Export to .pcap” button.

Settings
Setting |
Description |
Default |
|---|---|---|
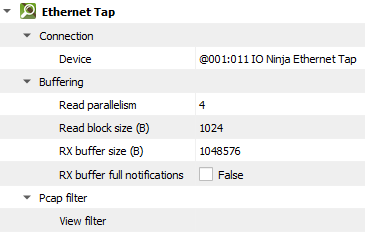
Device |
The Ethernet Tap that should be used. |
|
Read parallelism
(Windows-only)
|
Maximum number of read requests to issue in parallel. Having more than one pending read at a time helps with increasing read throughput when incoming data arrives in rapid streams (after filling one user buffer, the kernel can immediately switch to the next one without any waiting). Increasing this number beyond 4 usually won’t yield any extra performance gains. |
4 |
Read block size (B) |
The size of each individual read block submitted to the underlying transport. |
4KB |
RX buffer size (B) |
The full size of the incoming data ( |
16KB |
RX buffer full notifications |
Toggle warnings in log about the incoming data ( |
False |
View filter |
Term to filter with when displaying packets. Packets filtered this way are still captured, but are just not shown in the log. You can see these filtered packets again by removing this filter. |