Pipe Monitor
The Pipe Monitor plugin is a sophisticated tool designed for professionals like security analysts, reverse engineers, and system developers. It empowers users to deeply analyze Windows IPC through named and anonymous pipes, addressing a critical need for debugging and understanding proprietary communication protocols.
Basic Setup
Ensure Tibbo Device Monitor is installed
Note
Pipe Monitor uses the Device Monitor service, consisting of a kernel-mode module intercepting requests from applications to the specified devices and a user-mode configuration utility.
Installation and proper configuration of the Device Monitor service are sometimes stumbling points for users. Please follow these knowledge base articles for more information:
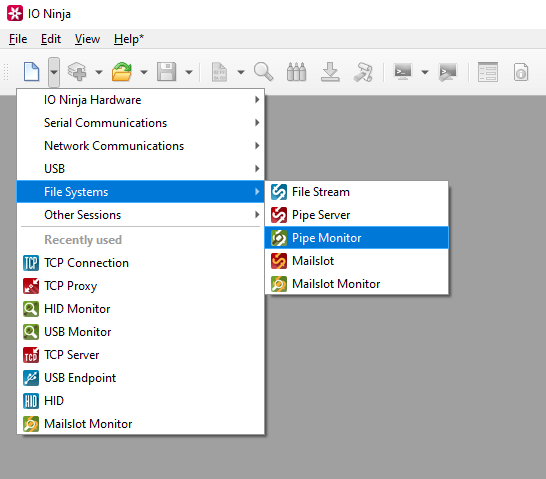
In IO Ninja, click the “New Session” dropdown and select a new “Pipe Monitor” session
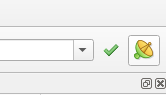
Click the “Capture” button on the far right of the filter bar.
Note
If you encounter an “Access is denied” error, please refer to our knowledge base.
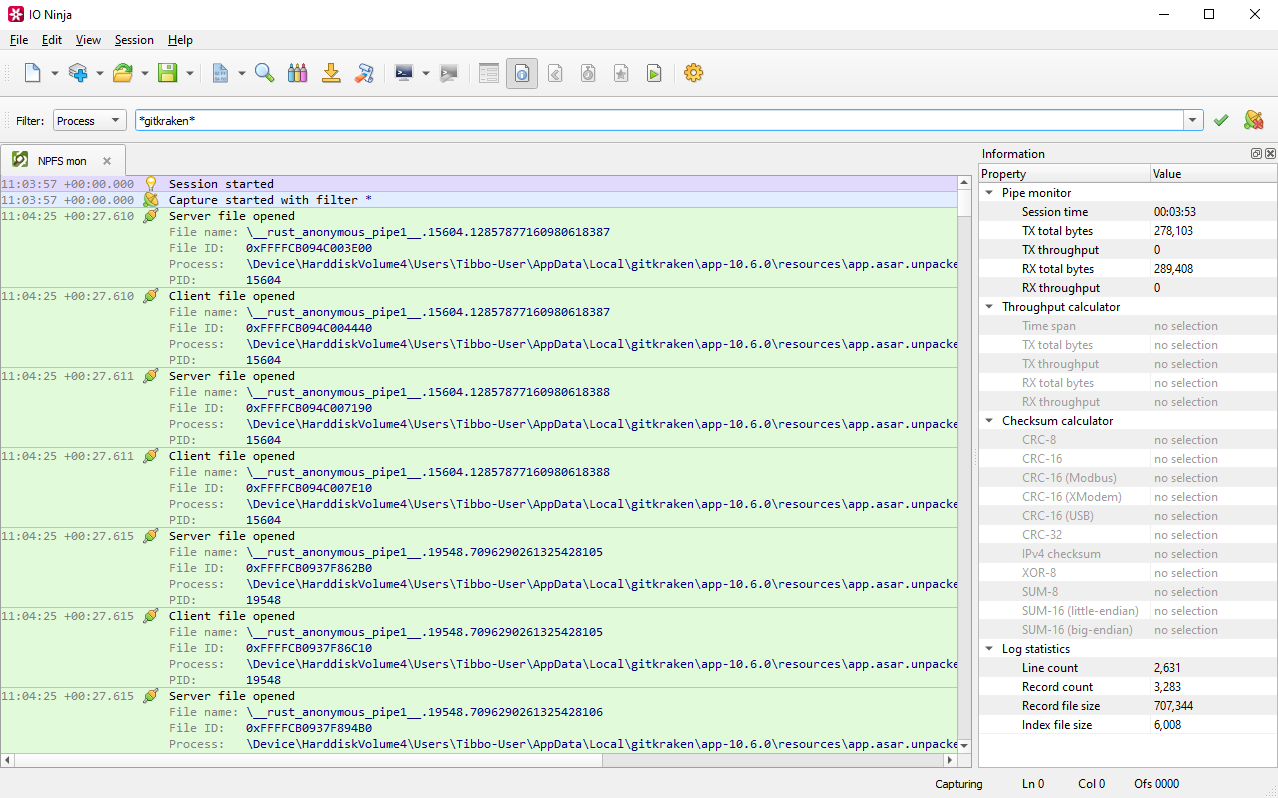
Type a wildcard to filter your results and click the green check button to apply them.
Settings
Setting |
Description |
Default |
|---|---|---|
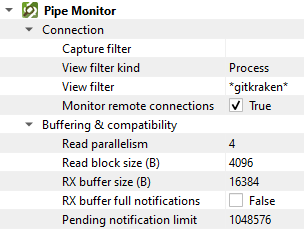
Capture filter |
Only capture notifications from pipes if their names match this wildcard. Events on all other pipes will be ignored completely. |
|
View filter kind |
The second layer of filtering. After notifications from pipes are captured and written to the log, you can further filter what you see by applying a View Filter to the log. This specifies the mode of this view filter. See available options. |
None |
View filter |
The actual view filter depending on View filter kind. |
|
Monitor remote connections |
Also capture pipe communications through the Windows Network (e.g., when you connect to a remote pipe like |
on |
Read parallelism |
Maximum number of read requests to submit to |
4 |
Read block size (B) |
The size of each individual read block submitted to |
4KB |
RX buffer size (B) |
The full size of the incoming data ( |
16KB |
RX buffer full notifications |
Toggle warnings in log about the incoming data ( |
off |
Pending notification limit |
The size of the |
1MB |
Note
In a name wildcard, you can use ? (any single character) and * (any number of any characters).
View Filter Kinds
Filter kind |
Description |
|---|---|
None |
No filtering applied - notifications from all pipes are visible. |
File name |
Filter by file name. Only notifications from the pipes with names that match the specified wildcard are visible. |
File ID |
Filter by file ID. Only notifications from this specific instance of the pipe are visible. Typically, you would start capturing with a broader filter (or no filter at all), and then if you want to isolate a single conversation through a specific instance of the pipe, you filter by file ID. |
Process |
Filter by process name. The log will only contain notifications from the pipes that are created by a process with a name that matches the specified wildcard. |
PID |
Filter by process ID. The log will only contain notifications from the pipes that are created by a process with this ID. |